
739 Rolling Fork Dr
Brentwood, TN 37027
Demographics of Brentwood, TN
Quality of Life at 739 Rolling Fork Dr
A high quality of life with strong walkability, manageable living costs, healthy neighborhood signals, and solid amenity access.
What does Quality of Life tell us?
Quality of Life blends cost of living, nearby amenities, socioeconomic signals, and neighborhood character. This reflects the property and its immediate surrounding area.
What does this tell us?
Quality of Life blends cost of living, nearby amenities, socioeconomic signals, and neighborhood character. This reflects the property and its immediate surrounding area.
Cost of Living
228% above national average
The Real Cost of Living in Brentwood, TN for 2026
| Tier | Individual | Family (4) |
|---|---|---|
| Survival | $56k | $105k |
| Comfortable | $202k | $297k |
| Luxury | $343k+ | $532k+ |
| Elite (Top 5%) | $437k+ | $677k+ |
64%
The Area Signal
A metric tracking the socioeconomic signals of the area.
Hobbies
Explore the areaGroceries
6 within 10 miles
Gas
20 within 10 miles
Hospital
20 within 20 miles
Airport
BNA — Nashville International
Post Office
USPS — Brentwood, TN
Critical Amenities
Affluence Level in Brentwood, TN
A wealthy area with high-earning, well-educated households. Incomes, home values, and educational attainment meaningfully outpace national averages.
Schools for 739 Rolling Fork Dr
Learn more about schools in Brentwood on GreatSchools.org
Crime around 739 Rolling Fork Dr
Lower crime rates than 92% of comparable U.S. locations.
Violent CrimeViolent Crime Analysis
Property CrimeProperty Crime Analysis
Political ClimatePolitical Climate around 739 Rolling Fork Dr
Inherited from parent state — no local data available.

Personal Sovereignty at 739 Rolling Fork Dr
Moderate friction. Expect trade-offs in some aspect of personal liberty and independence.
What does Personal Sovereignty tell us?
Personal Sovereignty measures your capacity for self-reliance and independence with minimal government friction. Higher scores mean fewer barriers between you and the way you want to live... but it assumes you have the space you need and good neighbors.
What does this tell us?
Personal Sovereignty measures your capacity for self-reliance and independence with minimal government friction. Higher scores mean fewer barriers between you and the way you want to live... but it assumes you have the space you need and good neighbors.
State Policy
Energy independence: Importer (25% of energy produced in-state)
Personal Liberty
Homesteading
Strategic Assessment of 739 Rolling Fork Dr
Multiple tactical vulnerabilities. Population density, target proximity, or disaster risk are likely compounding. A retreat property and exit planning is required.
What does the Strategic Assessment tell us?
Our Strategic Assessment grades tactical survivability of an area. Major population centers, military targets, fallout zones, natural disasters, and border exposure all drive risk — lower exposure means a more defensible position in a crisis.
This is heavily inspired by Joel Skousen's Strategic Relocation book. Highly recommended you checkout the book ($)What does this tell us?
Our Strategic Assessment grades tactical survivability of an area. Major population centers, military targets, fallout zones, natural disasters, and border exposure all drive risk — lower exposure means a more defensible position in a crisis.
This is heavily inspired by Joel Skousen's Strategic Relocation book. Highly recommended you checkout the book ($)Strategic Pillars
Key Distances
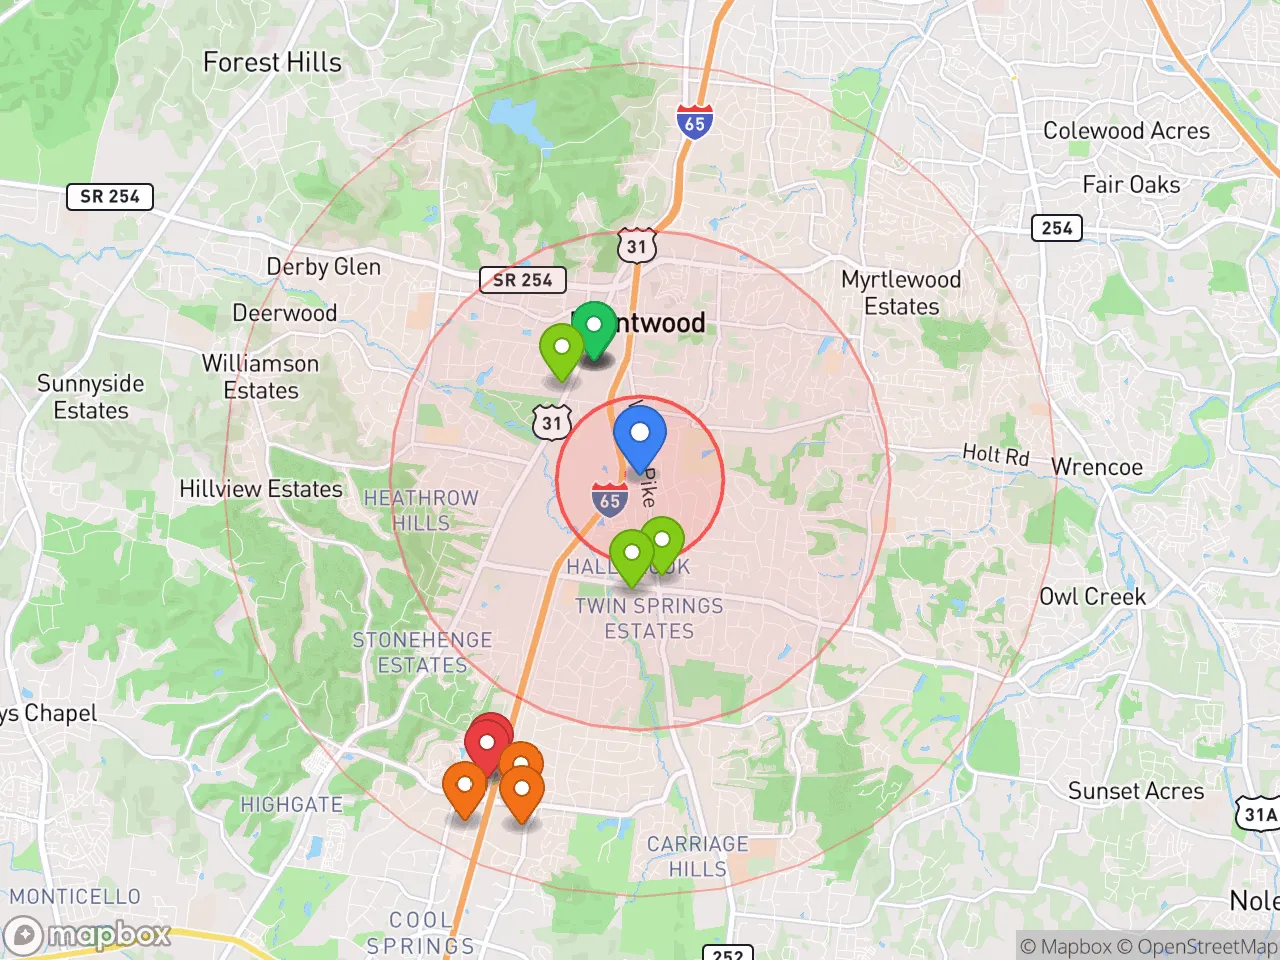
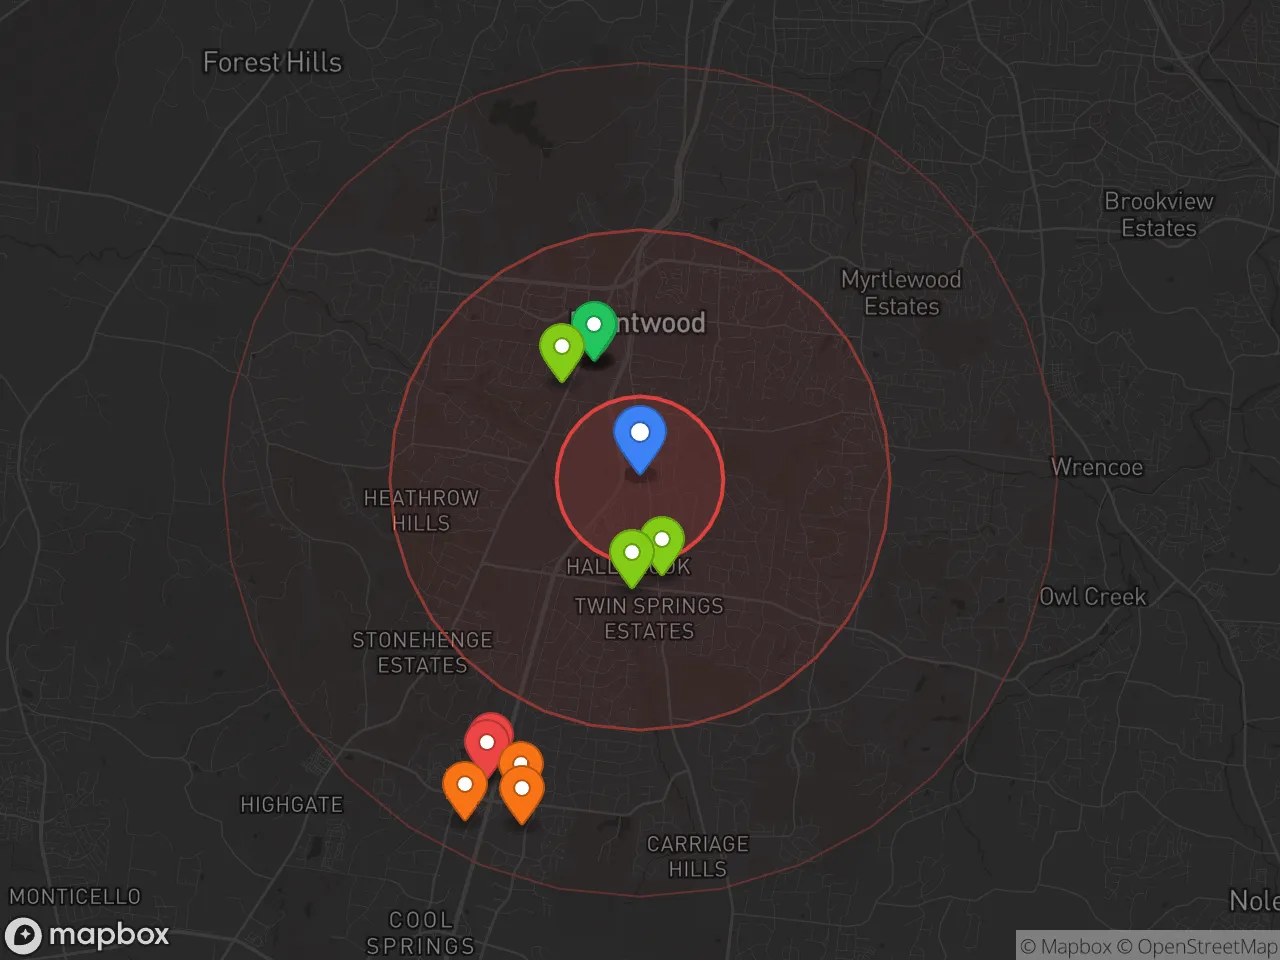
Regional Safe Places
Below is our recommended "safe zones" in Tennessee and the surrounding area based on our strategic heuristics. For most people, it's unrealistic to live in a “safe zone” full-time due to work, family or other personal reasons. They tend to be more rural. However, many of these areas are perfect for second homes and retreat properties that double as a vacation home or even a short-term rental.
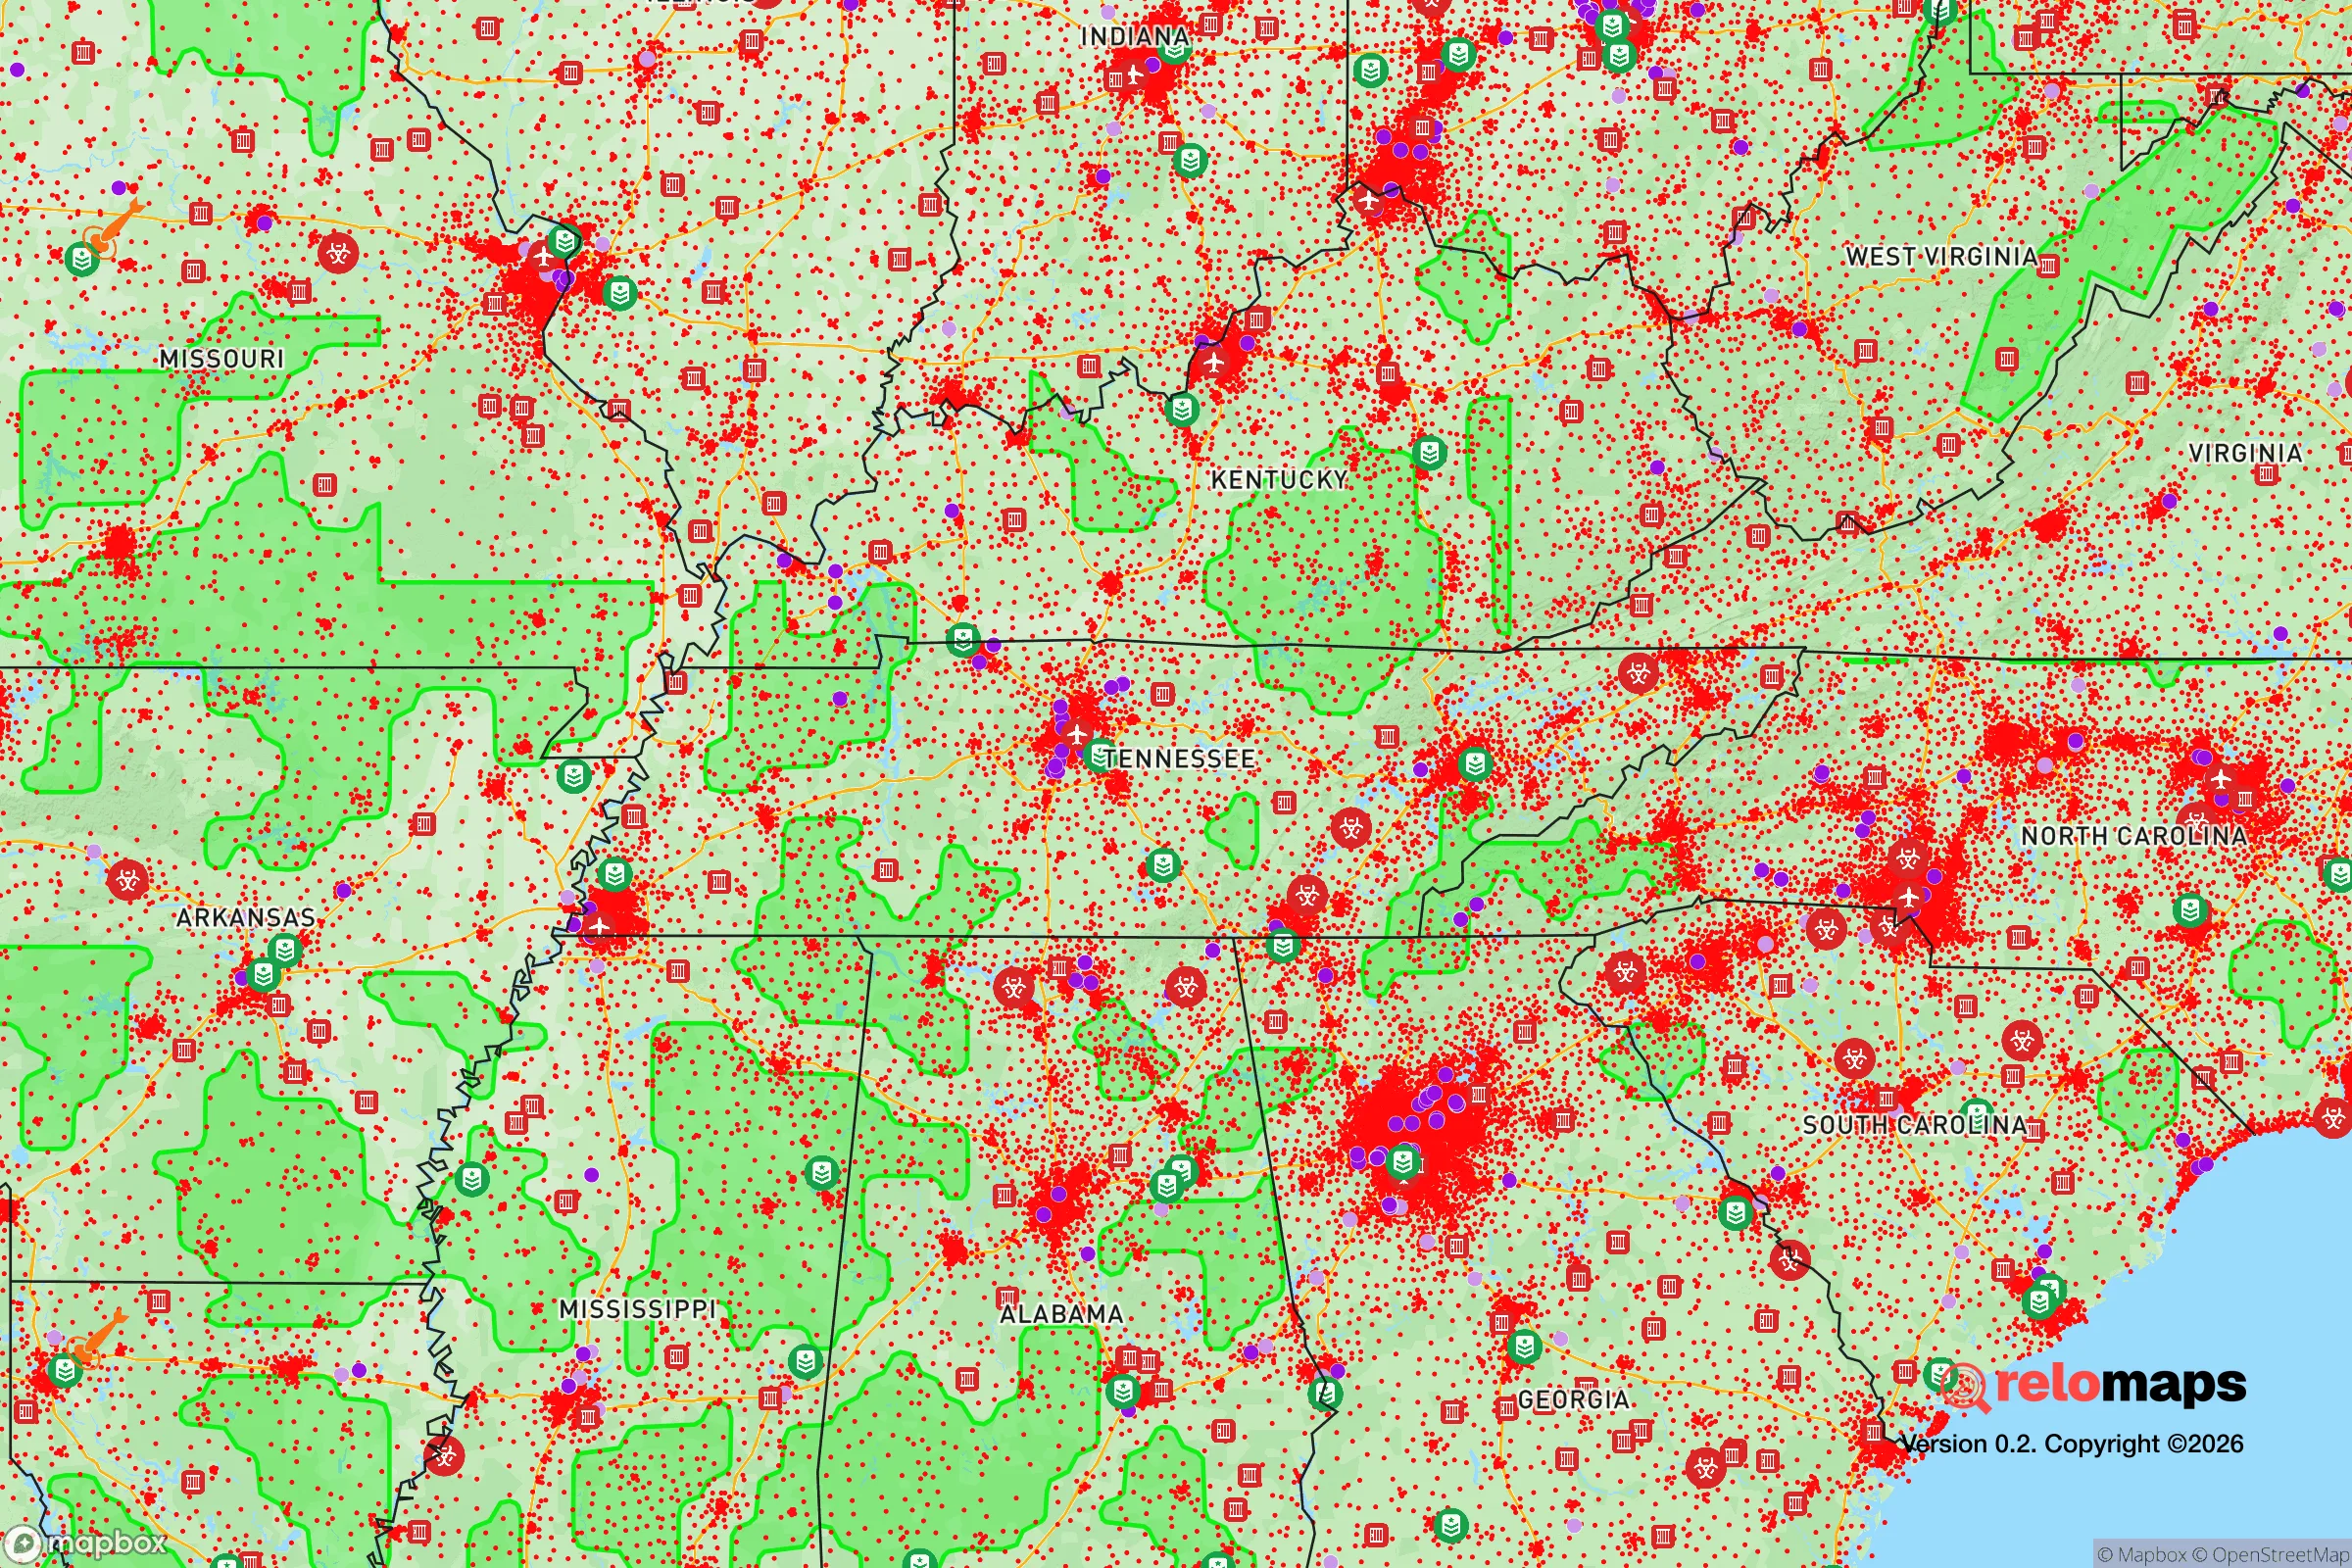
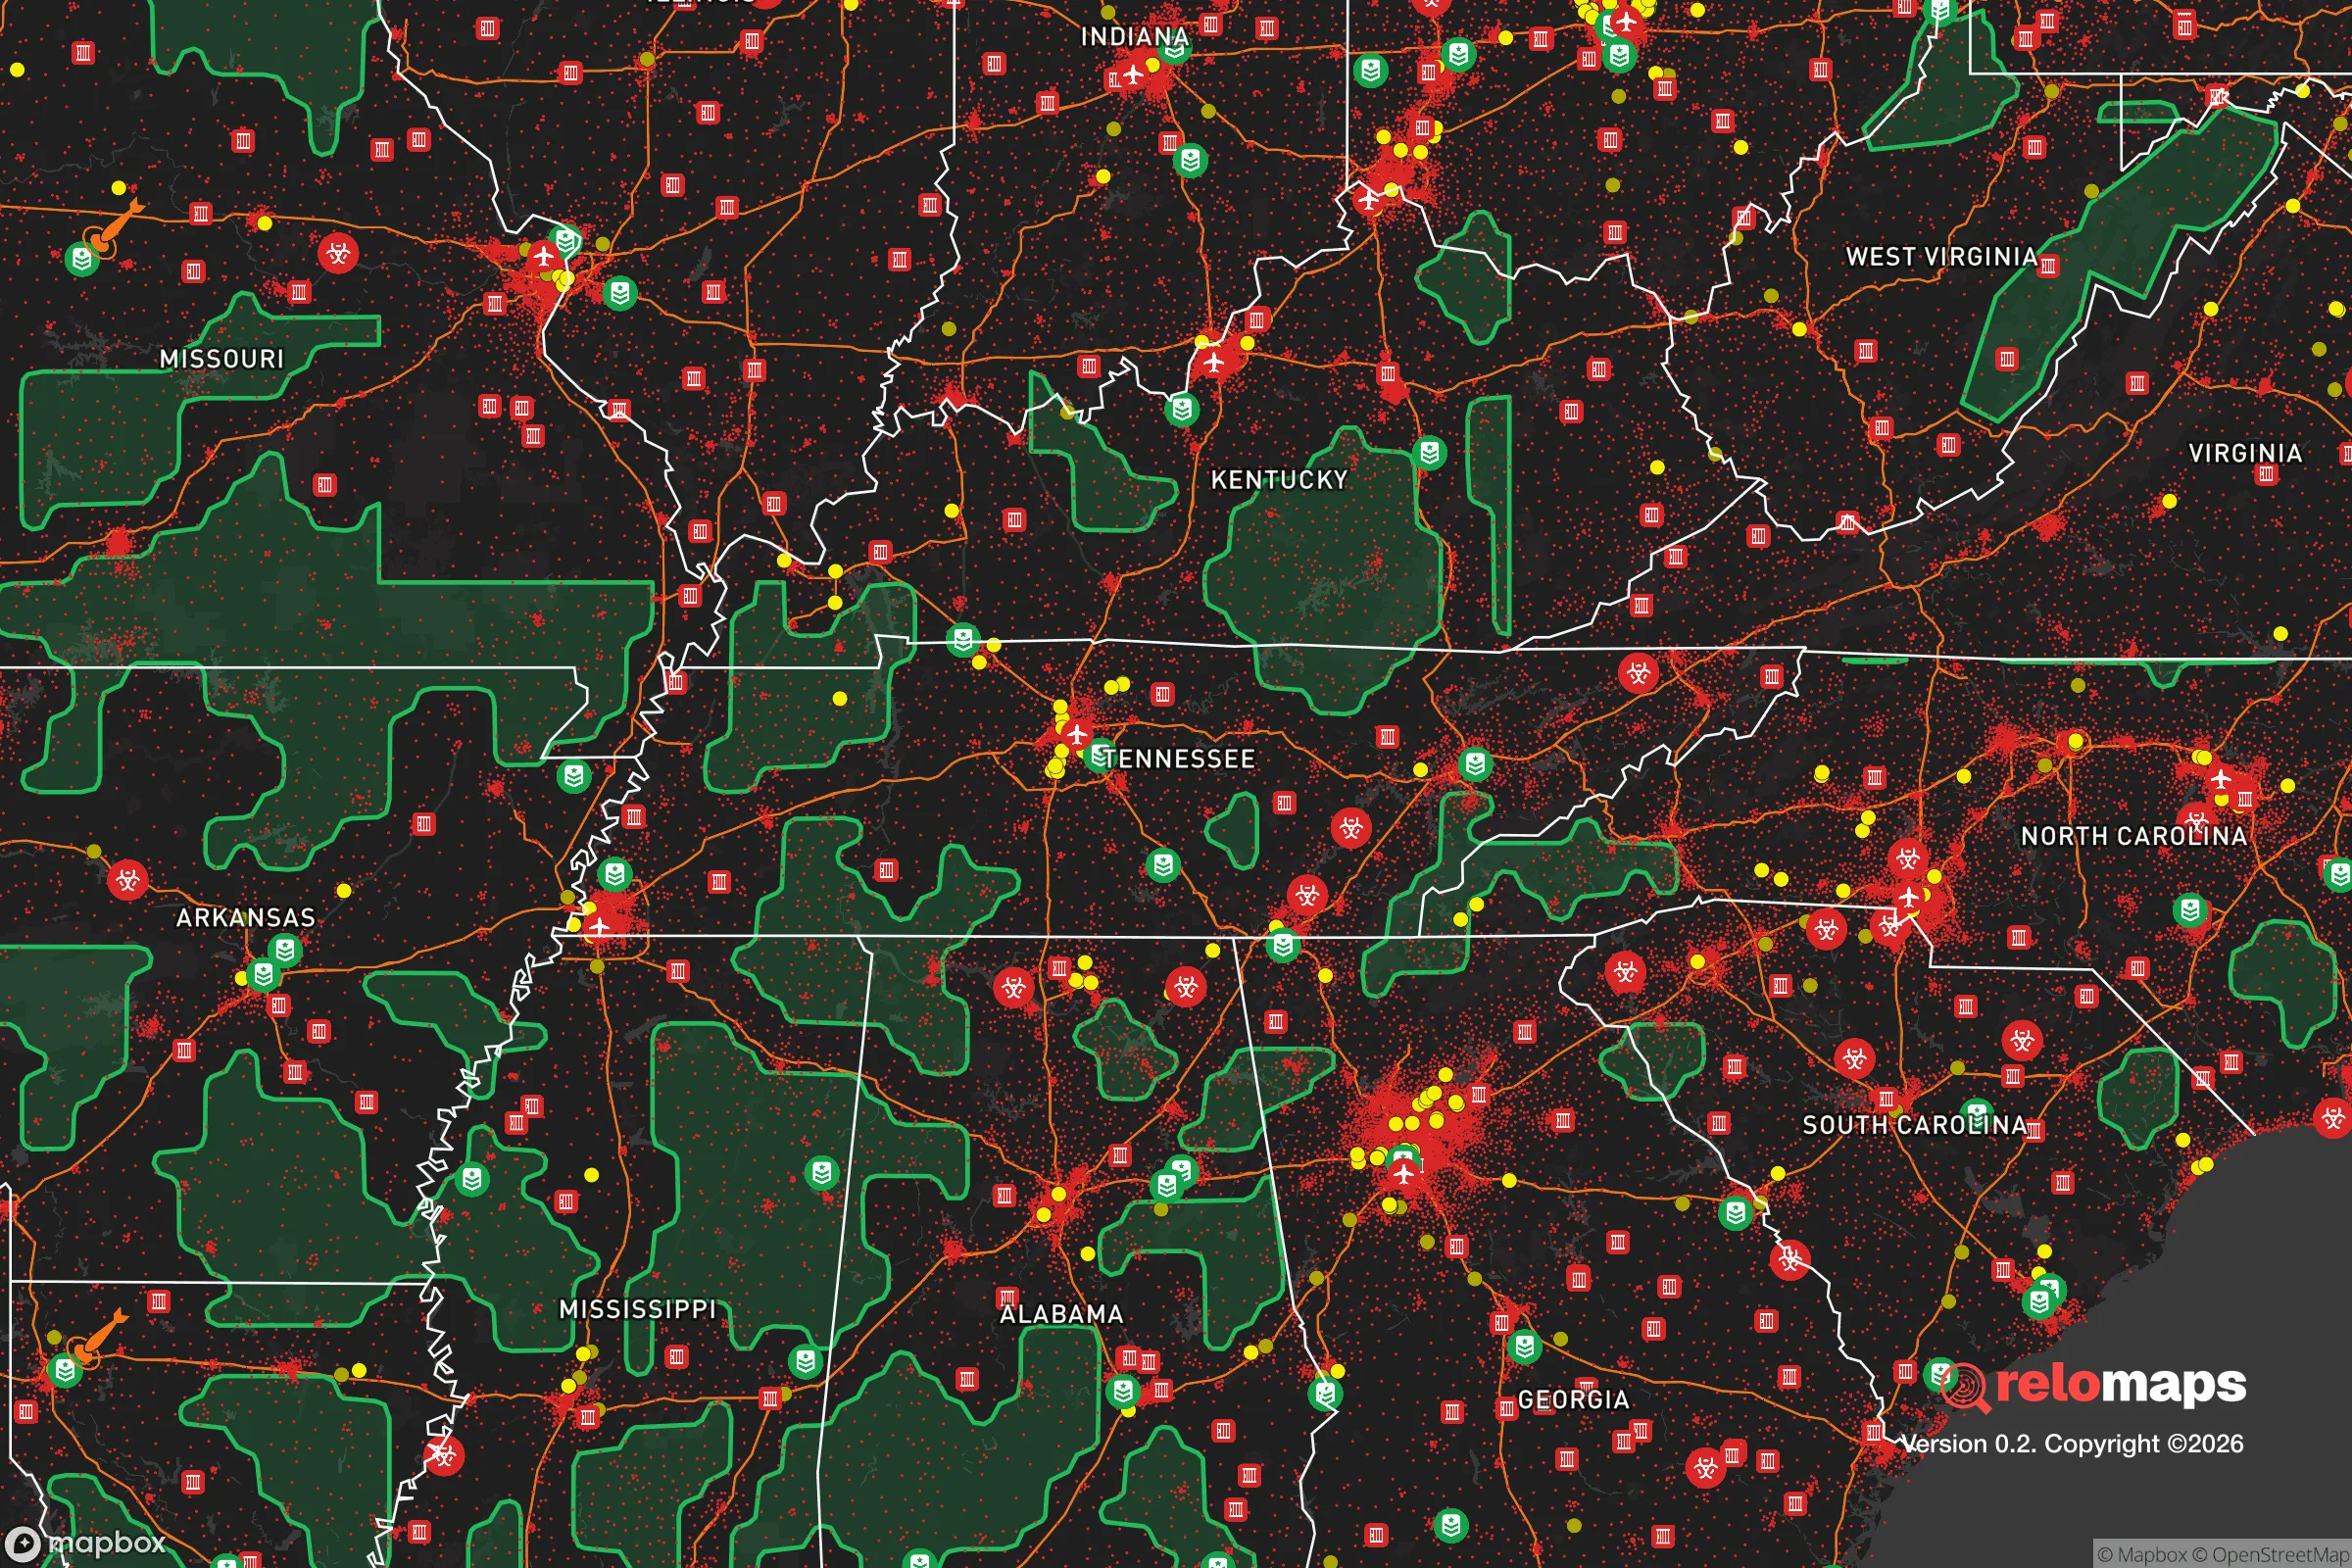
Important Note: For informational purposes only. This does not mean nothing bad ever happens in the green zones. Please use common sense. This is based on public data and modeled with AI. We tried to take a conservative approach but mistakes happen. We update this regularly as new information becomes available.
The Strategy: Plan a Retreat
This property is outside our identified safe zones, but the nearest one is roughly 49 miles southwest. We recommend a retreat property — a cabin or second home — inside that safe area, plus a tested plan and stocked vehicle to get there in case of an emergency.
Important Note: Always verify information with official sources and consult with professionals for personalized advice based on your risk profile.
* Values derived from national, state, county, city and local statistics and may differ in a specific area. Last updated: 2026-05-02T01:20:18.000Z
Narrative content on this page is AI-generated and may contain mistakes. Verify any details that matter before acting on them.
ReloMaps may earn a commission from affiliate links at no extra cost to you.