Photo: Wikipedia
Quality of Life in Hanover, PA
Above-average quality of iife. The area offers a reasonable cost of living, decent mobility, and a mix of neighborhood amenities.
What does Quality of Life tell us?
Quality of Life blends cost of living, nearby amenities, socioeconomic signals, and neighborhood character. City-level scores represent the whole municipality; individual neighborhoods can differ.
What does this tell us?
Quality of Life blends cost of living, nearby amenities, socioeconomic signals, and neighborhood character. City-level scores represent the whole municipality; individual neighborhoods can differ.
Cost of Living
15% below national average
The Real Cost of Living in Hanover, PA for 2026
| Tier | Individual | Family (4) |
|---|---|---|
| Survival | $17k | $33k |
| Comfortable | $39k | $57k |
| Luxury | $100k+ | $155k+ |
| Elite (Top 5%) | $118k+ | $182k+ |
112%
The Area Signal
A metric tracking the socioeconomic signals of the area.


Hobbies
Explore the areaGroceries
1 within 10 miles
Gas
0 within 10 miles
Hospital
3 within 20 miles
Airport
BWI — Baltimore/Washington International Thurgood Marshall Airport (BWI)
Post Office
USPS — Hanover, PA
Critical Amenities
Quality-of-Life Analysis
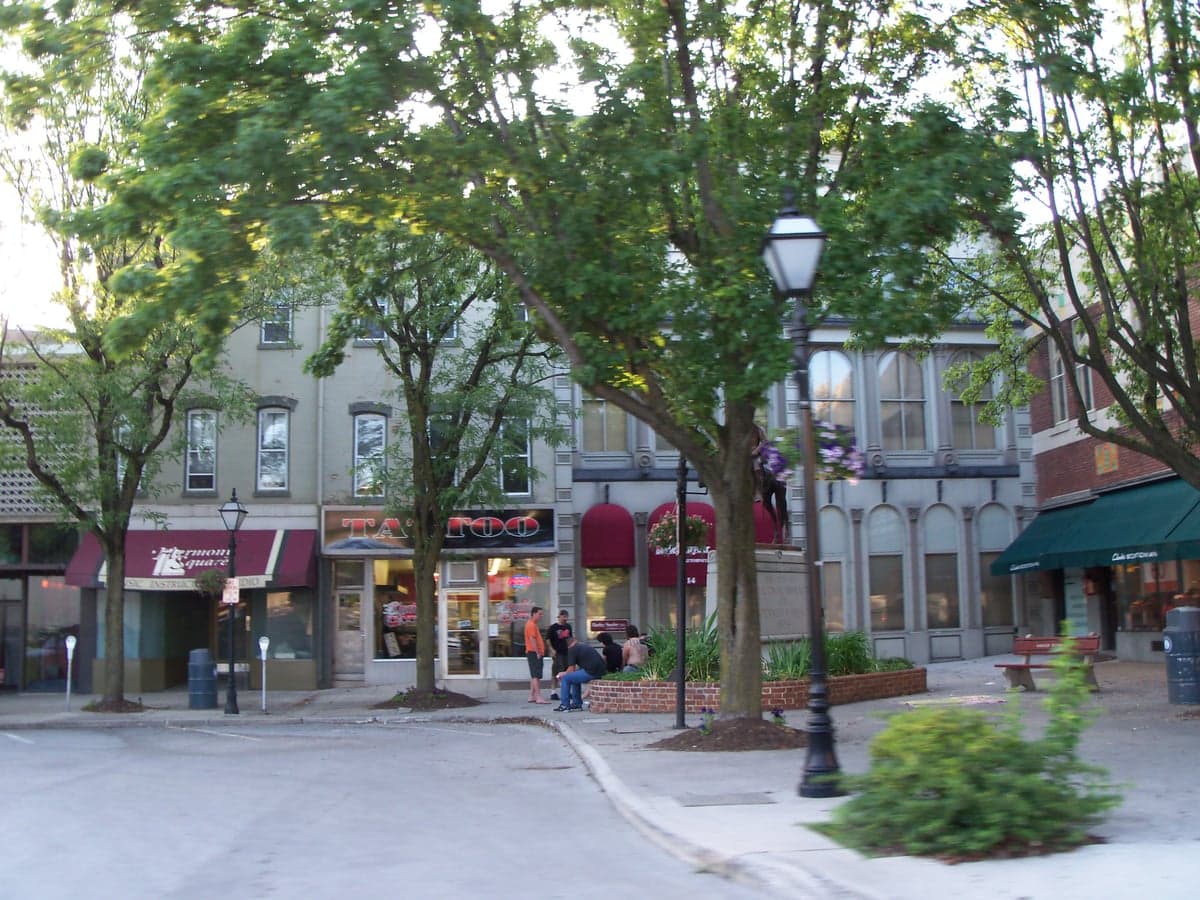
Hanover, Pennsylvania, offers a quality of life defined by small-town affordability and a predominantly family-oriented, middle-class population. With a cost of living index of 85—15 percent below the national average—the area attracts residents seeking economic stability and a slower pace than nearby metro hubs like Baltimore or Harrisburg. The community is largely composed of long-term homeowners, young families, and retirees drawn to the town's historic downtown and proximity to the York County countryside.
Cost of living, housing, and affordability compared to nearby areas
Hanover's housing market is a primary driver of its low cost of living. The median home value sits at $200,900, significantly lower than the national median of roughly $350,000 and far below the Baltimore metro average of over $400,000. Median rent is $1,095, making the town an accessible option for renters who would face much higher prices in Harrisburg (around $1,300) or Gettysburg (around $1,200). The average commute time of 23.2 minutes is slightly shorter than the national average of 26 minutes, reflecting the area's manageable traffic and the prevalence of local manufacturing and logistics jobs. While property taxes in Hanover Borough are moderate, the overall tax burden in York County remains lower than in neighboring Maryland, a key factor for cross-border movers.
Local amenities, schools, and the daily-life rhythm
Daily life in Hanover centers on its walkable downtown square, which hosts seasonal farmers' markets and community events like the Hanover Dutch Festival. The Hanover Public School District serves most of the borough, with a student-teacher ratio of roughly 14:1 and a graduation rate near 90 percent. For shopping and dining, residents rely on the Eisenhower Drive corridor and nearby West Manchester Town Center, while outdoor recreation includes Codorus State Park and the Hanover Area YMCA. The town's manufacturing heritage remains visible through employers like Utz Quality Foods and Hanover Shoe Farms, giving the local economy a blue-collar backbone. Healthcare access is solid, with UPMC Hanover hospital providing emergency and specialty care within the borough limits.
Hanover is best suited for those who value affordability, community connection, and a slower daily rhythm without sacrificing access to urban amenities. Families benefit from the low housing costs and solid public schools, while retirees appreciate the walkable downtown and lower tax burden. Commuters who work in Baltimore or Harrisburg will find the 45- to 60-minute drive a reasonable trade-off for significantly cheaper housing. However, those seeking nightlife, cultural diversity, or rapid career growth in tech or finance may find Hanover too quiet. For anyone prioritizing financial breathing room and a tight-knit, historically rooted community, Hanover delivers a stable and practical quality of life.
Crime in Hanover, PA
Lower crime rates than 81% of comparable U.S. locations.
Violent CrimeViolent Crime Analysis
Property CrimeProperty Crime Analysis
Crime Analysis
Hanover, Pennsylvania, presents a mixed safety profile that diverges sharply from national averages. The town's violent crime rate of 101.2 incidents per 100,000 residents is significantly lower than the national median, placing it among the safer small towns in the state. However, its property crime rate of 2,083.7 per 100,000 is notably elevated, nearly matching the national average and exceeding the typical rate for rural Pennsylvania communities. This combination creates a situation where residents generally feel safe from violent threats but face a tangible risk of theft, burglary, and vehicle break-ins.
Crime in context
When compared to state and national benchmarks, Hanover's violent crime rate is a clear positive. The national violent crime rate hovers around 380 per 100,000, meaning Hanover's rate is roughly 73% lower. Even within Pennsylvania, which has a relatively low statewide violent crime rate of approximately 280 per 100,000, Hanover stands out as safer. The property crime picture is less reassuring. The national property crime rate is about 1,950 per 100,000, and Hanover's rate of 2,083.7 per 100,000 sits just above that mark. This is substantially higher than the Pennsylvania statewide property crime rate of roughly 1,400 per 100,000. The disparity suggests that while violent confrontations are rare, property crimes—particularly thefts from vehicles and unlocked homes—are a persistent concern. Readers should note that Hanover is part of the broader York-Hanover metropolitan area, which is influenced by the policies of York County. York County has seen a shift toward more progressive prosecutorial approaches in recent years, which some analysts link to higher recidivism and a greater number of offenders cycling through the system, potentially contributing to the elevated property crime numbers.
What residents experience
Daily life in Hanover for most residents is not marked by fear of violent crime. The low violent crime rate means that random assaults, robberies, or homicides are uncommon events. The primary safety concern for the average resident is property crime. Larceny-theft accounts for the vast majority of property crimes, followed by burglary and motor vehicle theft. Residents frequently report issues with package theft, unlocked car break-ins, and theft from yards or sheds. The Hanover Police Department maintains a visible presence in the downtown core and residential neighborhoods, but the department's resources are stretched thin by the volume of property crime calls. Neighborhood watch programs are active in several subdivisions, and the department encourages residents to secure vehicles and outbuildings. The presence of progressive judicial policies in the broader York County system—including diversion programs and reduced sentencing for property offenders—has been cited by local law enforcement as a factor that reduces deterrence and increases the likelihood that repeat offenders will remain on the street.
Neighborhood-level variation is notable. The historic downtown area and the blocks immediately surrounding it see the highest concentration of property crime, particularly thefts from parked cars and shoplifting. The newer subdivisions on the town's northern and eastern edges, such as those near Hanover Hospital and the Penn State Health campus, report significantly lower property crime rates. The area around the Hanover Mall and along Eisenhower Drive also sees elevated theft-related incidents. For those considering a move, properties in the outer residential rings and newer developments offer a demonstrably lower risk of property crime, while downtown living requires more vigilance regarding vehicle and home security. Overall, Hanover is a safe community by violent crime metrics, but the property crime rate—exacerbated by a lenient regional justice environment—demands practical precautions from residents.
* Values derived from national, state, county, city and local statistics and may differ in a specific area. Last updated: 2026-04-19T10:23:21.000Z
Narrative content on this page is AI-generated and may contain mistakes. Verify any details that matter before acting on them.
ReloMaps may earn a commission from affiliate links at no extra cost to you.