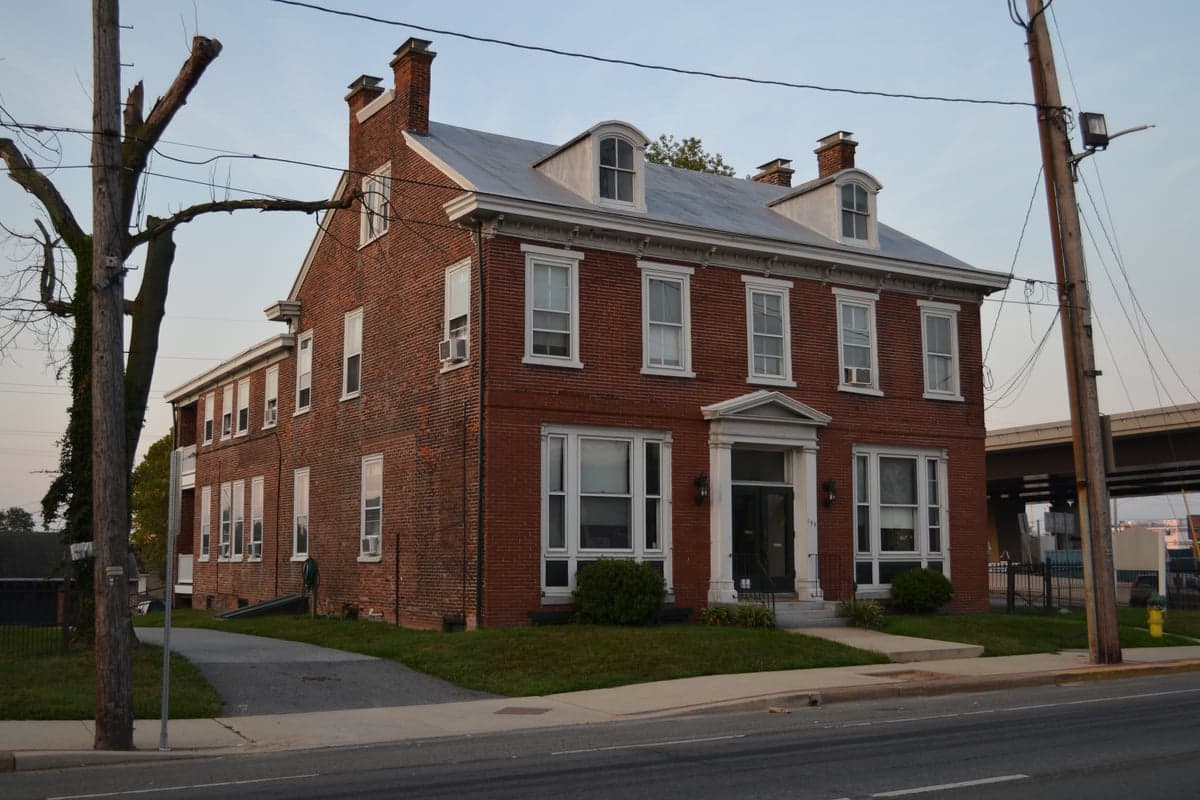
Photo: Wikipedia
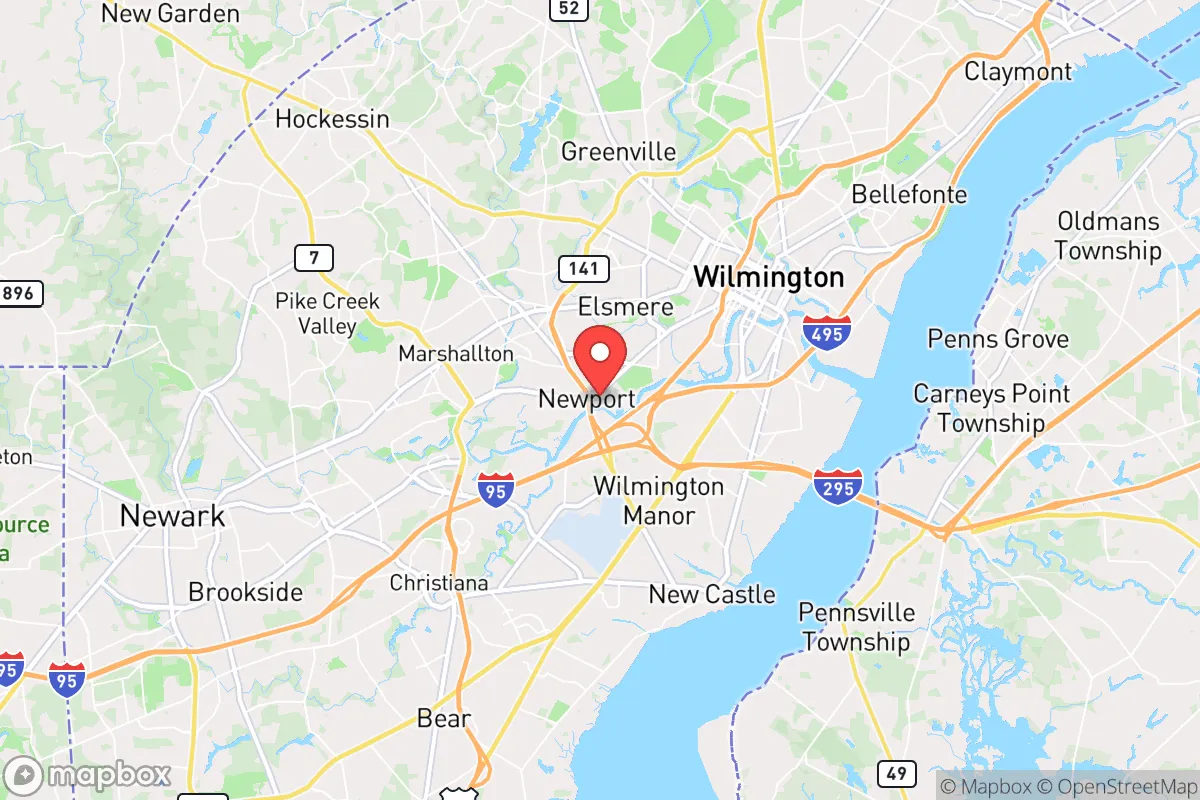
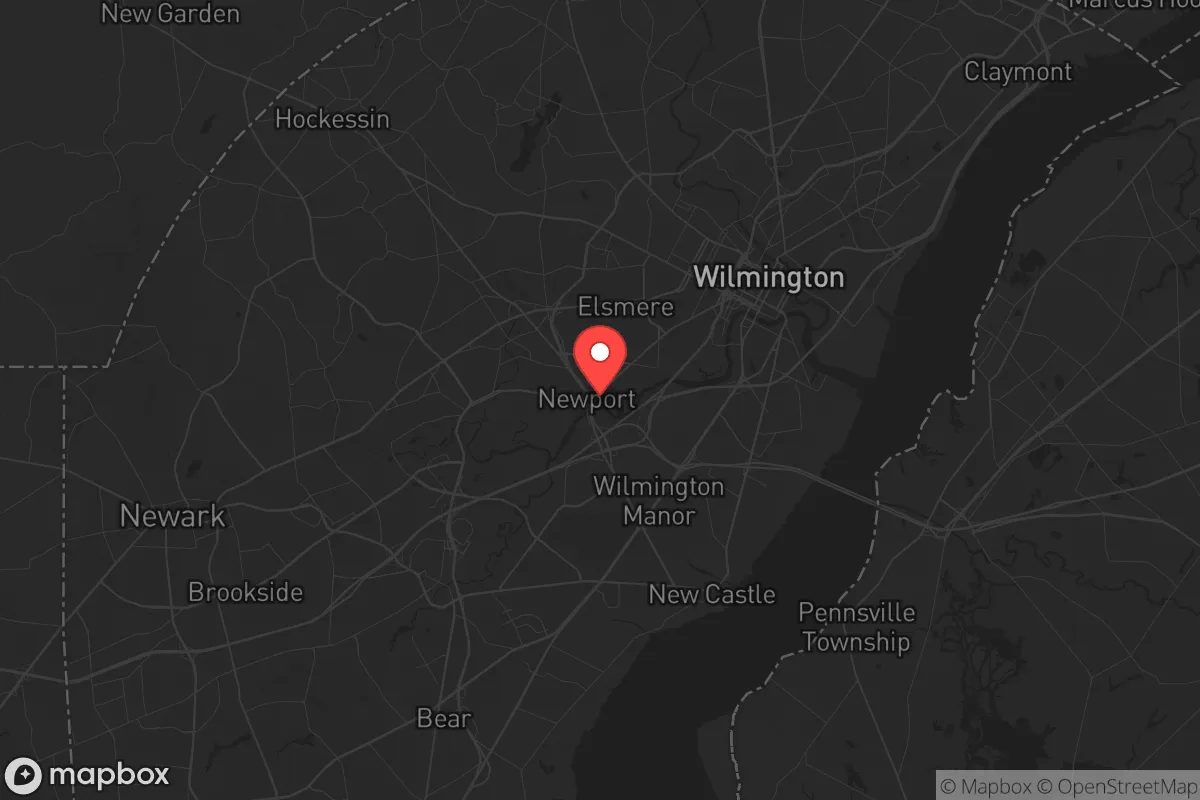
Demographics of Newport, DE
Affluence Level in Newport, DE
A below-average socioeconomic profile. Incomes, home values, and educational attainment trail the U.S., with higher poverty and unemployment.
People of Newport, DE
The people of Newport, Delaware today form a compact, working-class community of 1,209 residents, notable for its racial and ethnic diversity within a small footprint. The city is densely populated, with a character shaped by its industrial past and its position as a lower-cost alternative to nearby Wilmington. Distinctive identity markers include a significant Hispanic population at 25.8%, a nearly equal Black population at 24.2%, and a White population of 43.3%, creating a tri-ethnic balance uncommon in small Delaware towns. The foreign-born share of 12.1% is elevated for a town this size, and the college-educated rate of 12.3% is low, reflecting a blue-collar, family-oriented population.
How the city was settled and grew
Newport’s population history begins with its founding in the 18th century as a milling and shipping hub on the Christina River. The original settlers were English and Welsh farmers and millers, drawn by the fertile river valley and the promise of water-powered industry. The historic Old Newport neighborhood, centered on Market Street and the riverfront, was built by these early families and retains a handful of 18th- and 19th-century homes. A second wave arrived in the mid-19th century with the construction of the Philadelphia, Wilmington and Baltimore Railroad, which brought Irish immigrants to work on the tracks and in the local mills. These Irish families settled in the Railroad District along the tracks near the modern-day Amtrak line, an area that remained predominantly Irish through the early 1900s. A third wave of Italian and Polish immigrants came in the early 20th century, drawn by jobs in the nearby DuPont powder mills and the emerging chemical industry along the Brandywine. They established themselves in the South Newport area, south of the main commercial strip, building small row homes and forming tight-knit Catholic parishes.
Modern era (post-1965)
The post-1965 era brought the most dramatic demographic shifts to Newport. The 1965 Hart-Cellar Act opened immigration from Latin America and Asia, and the city’s affordable housing stock and proximity to Wilmington’s service and manufacturing jobs attracted new arrivals. The first significant Hispanic wave came in the 1970s and 1980s, primarily from Puerto Rico and the Dominican Republic, settling in the West Newport neighborhood west of the railroad tracks. This area today has the highest concentration of Hispanic residents in the city, with many families running small bodegas and contracting businesses. A second Hispanic wave from Central America, particularly Guatemala and El Salvador, arrived in the 1990s and 2000s, expanding the Hispanic population to its current 25.8% share. Meanwhile, Black families moved into Newport from Wilmington and rural southern Delaware during the same period, drawn by lower rents and the city’s proximity to I-95. They concentrated in the East Newport neighborhood, east of Market Street, which today is predominantly Black and home to several historic African American churches. The White population, once the overwhelming majority, has declined steadily since 1970, falling to 43.3% as older families aged out and younger generations moved to larger suburban homes in Bear and Glasgow. The East/Southeast Asian population remains tiny at 1.1%, with no Indian subcontinent presence recorded, reflecting Newport’s limited draw for professional-class immigrants.
The future
Newport’s population is heading toward further diversification, but within a framework of economic stagnation. The Hispanic share is likely to continue growing, driven by both natural increase and continued immigration from Central America, as the city’s low housing costs remain attractive to new arrivals. The Black population appears stable, with families aging in place but limited new in-migration. The White population is projected to continue its gradual decline, as younger White residents leave for suburban school districts and newer housing. The city is not tribalizing into hostile enclaves—the small size forces daily interaction—but distinct neighborhood identities persist: West Newport is heavily Hispanic, East Newport is predominantly Black, and Old Newport retains a small White elderly cohort. The foreign-born share of 12.1% is likely to plateau or rise modestly, as the city lacks the job growth to attract large new immigrant waves. The college-educated rate of 12.3% is unlikely to rise significantly without major investment in housing or transit improvements that would draw a different demographic.
For someone moving in now, Newport is becoming a stable, working-class, multi-ethnic community where affordability is the primary draw. It is not gentrifying, not homogenizing, and not likely to see rapid change. The city offers a low-cost entry point into the Wilmington metro area, with a population that is increasingly Hispanic and Black, and a character that remains rooted in its industrial and immigrant past. New residents should expect a dense, walkable, older town with limited amenities but strong community ties.
* Values derived from national, state, county, city and local statistics and may differ in a specific area. Last updated: 2026-04-22T10:36:30.000Z
Narrative content on this page is AI-generated and may contain mistakes. Verify any details that matter before acting on them.
ReloMaps may earn a commission from affiliate links at no extra cost to you.