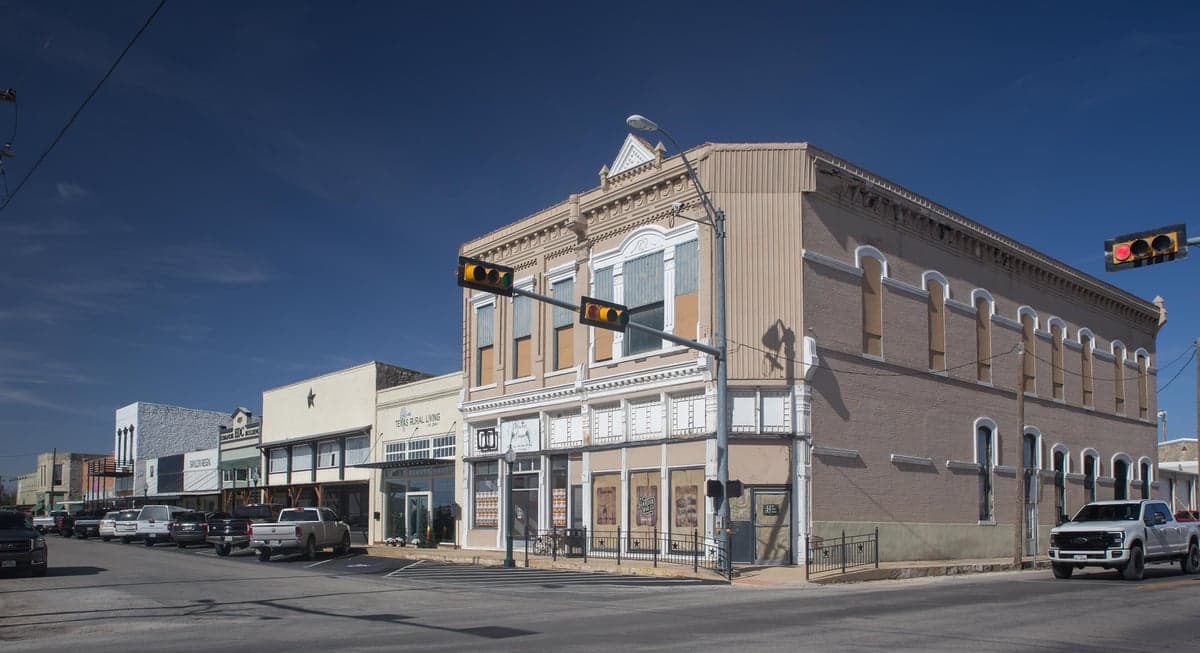
Photo: Wikipedia
Demographics of Comanche, TX
Affluence Level in Comanche, TX
A below-average socioeconomic profile. Incomes, home values, and educational attainment trail the U.S., with higher poverty and unemployment.
People of Comanche, TX
The people of Comanche, Texas today number 4,227, forming a community that is majority Hispanic (52.3%) with a substantial White non-Hispanic minority (43.1%). The city is notably less diverse in other groups, with a Black population of 1.3%, East/Southeast Asian residents at 0.1%, and no recorded Indian subcontinent population. With 11.1% foreign-born residents and a college education rate of just 12.8%, Comanche is a working-class, predominantly Hispanic and White town rooted in agricultural and oil-field labor, where family ties and local churches remain central to daily life.
How the city was settled and grew
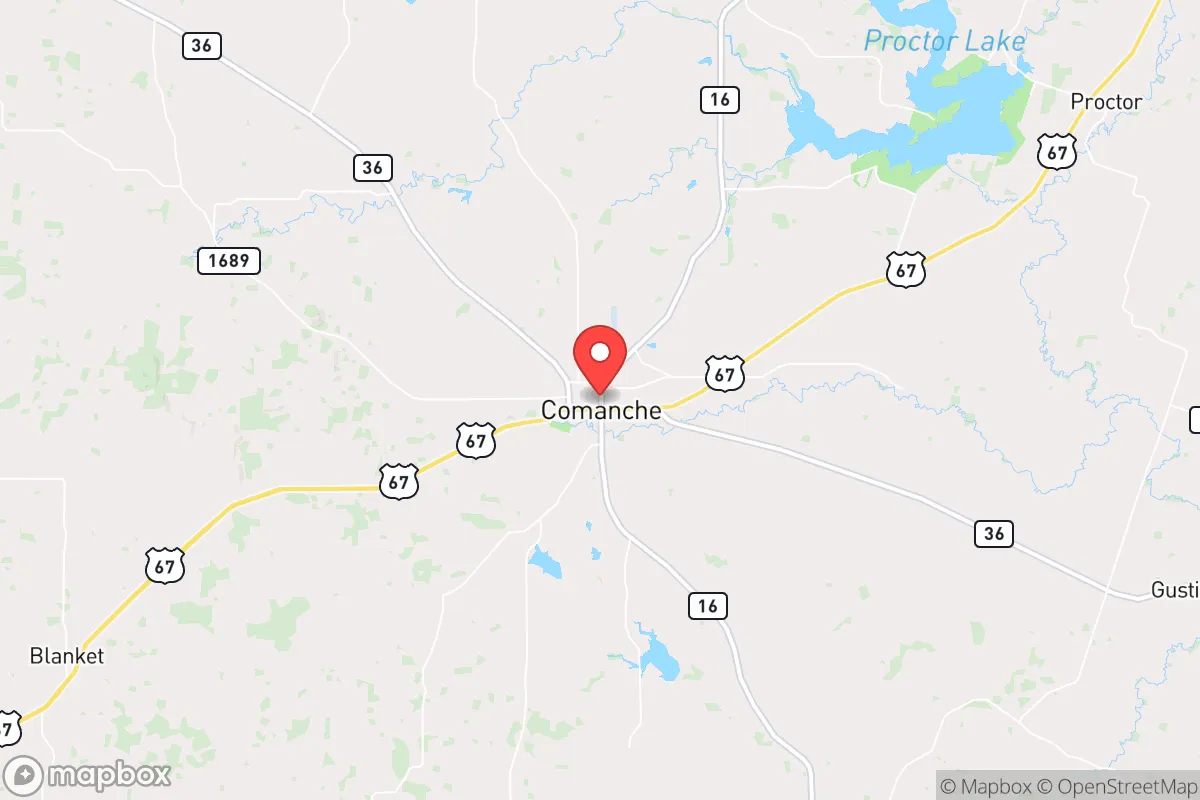
Comanche was founded in 1858 as the county seat of Comanche County, named after the Comanche tribe that had dominated the region. The first permanent settlers were primarily Anglo-American families from the southern United States—Tennessee, Kentucky, and Arkansas—who arrived via ox-drawn wagons after the Texas legislature created the county. These early pioneers built the first homes and businesses along the central Courthouse Square, which remains the historic heart of the city. The original settlement clustered around the square and along what is now Washington Street, where the first general stores, blacksmith shops, and saloons served the farming and ranching community. By the 1870s, cotton became the dominant cash crop, drawing additional Anglo farmers and a small number of Black families who worked as sharecroppers and laborers. The arrival of the Texas Central Railroad in 1886 spurred a second wave of growth, with new residential blocks laid out east of the square in what locals call the East Side neighborhood, where many railroad workers and merchants settled. The population remained overwhelmingly Anglo through the early 20th century, with a small Black community concentrated in the South Comanche area near the old cotton gin. The discovery of oil in the nearby Ranger field in the 1910s brought a brief boom of transient workers, but Comanche itself stayed a modest agricultural trade center.
Modern era (post-1965)
The most significant demographic shift in Comanche began in the 1970s and accelerated through the 1990s, as Hispanic families—primarily of Mexican descent—moved into the city for agricultural and construction work. This wave settled predominantly in the Westside neighborhood, west of the courthouse square, where older homes were subdivided into rental units and new modest houses were built on formerly vacant lots. By 2000, the Hispanic share of the population had risen to roughly 35%, and by 2020 it had become the majority at 52.3%. The White non-Hispanic population, while still substantial at 43.1%, has aged and declined in absolute numbers as younger Anglos have left for larger cities. The Black population, never large, has remained stable at around 1-2%, concentrated in the South Comanche area. The foreign-born share of 11.1% is almost entirely Hispanic, with many residents holding permanent resident status or U.S. citizenship. The East/Southeast Asian population (0.1%) is negligible, consisting of a handful of families who moved in for business or medical work. The city has not experienced significant suburbanization or new master-planned development; instead, growth has been organic, with new housing scattered along the edges of existing neighborhoods like North Comanche near the high school and East Comanche along Highway 36.
The future
Comanche's population is likely to continue its gradual Hispanicization, with the Hispanic share projected to reach 60-65% by 2040 based on current birth rates and migration patterns. The White non-Hispanic population will continue to age and decline, though it will remain a significant minority. The city is not tribalizing into distinct ethnic enclaves—Hispanic and White residents live intermingled in most neighborhoods, with the Westside being the most heavily Hispanic but not exclusively so. The foreign-born share may plateau or decline slightly as second- and third-generation Hispanic families become native-born. No significant growth is expected from East/Southeast Asian, Indian, or Black in-migration, as the local economy—dominated by agriculture, oil-field services, and small retail—offers limited attraction for those groups. The college education rate of 12.8% is unlikely to rise sharply unless a major employer (such as a prison or manufacturing plant) relocates to the area. The city will remain a small, working-class community where family networks and local churches—both Catholic and Protestant—anchor social life.
For someone moving in now, Comanche offers a stable, slow-growing environment where the population is becoming more Hispanic but remains culturally conservative and family-oriented. The city is not diversifying in a broad sense; it is transitioning from a predominantly Anglo town to a predominantly Hispanic one, with little change in overall economic or educational profile. New residents should expect a close-knit community where personal relationships and local reputation matter, and where the pace of life is unhurried.
* Values derived from national, state, county, city and local statistics and may differ in a specific area. Last updated: 2026-05-13T17:09:54.000Z
Narrative content on this page is AI-generated and may contain mistakes. Verify any details that matter before acting on them.
ReloMaps may earn a commission from affiliate links at no extra cost to you.