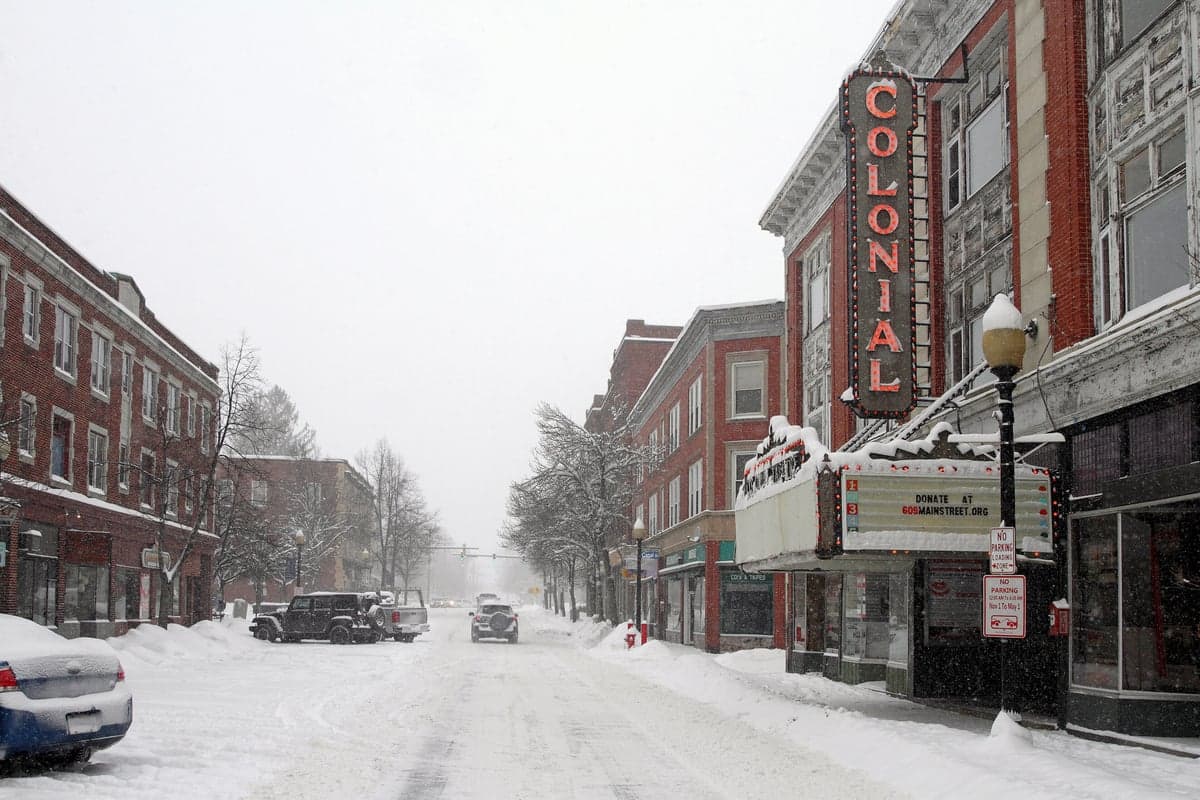
Photo: Wikipedia
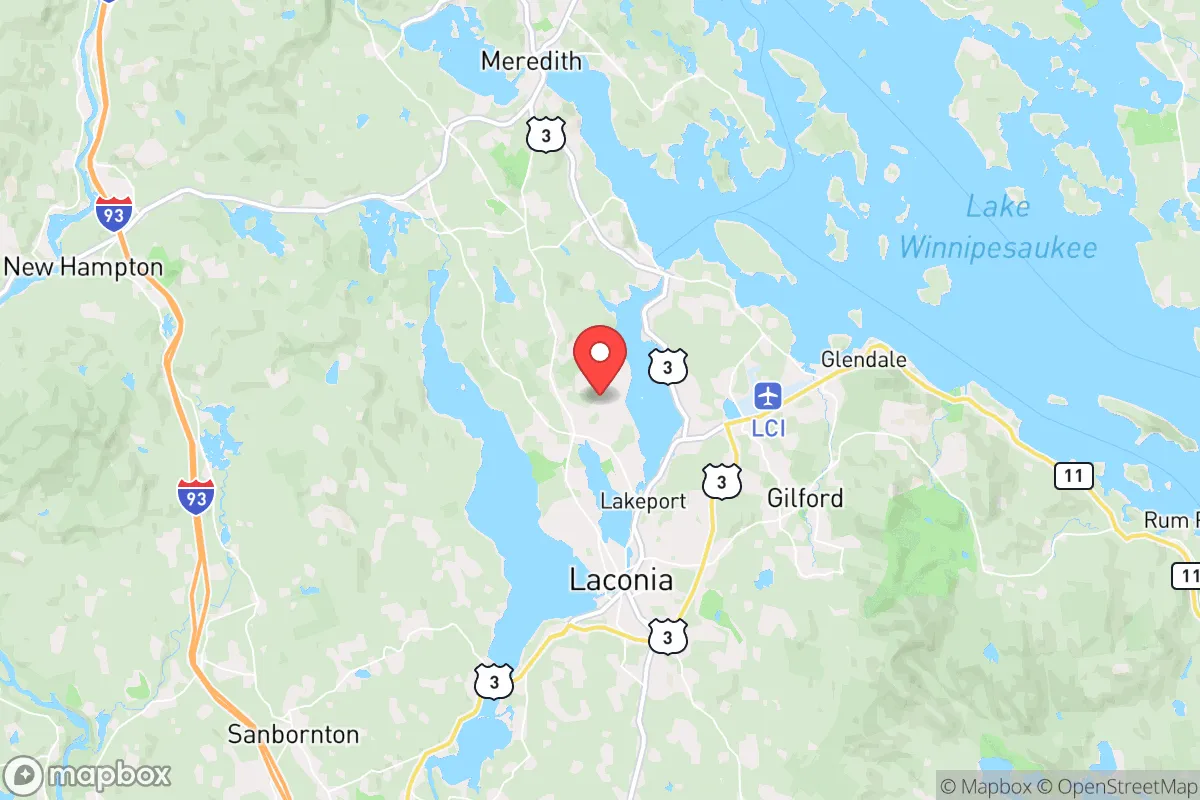
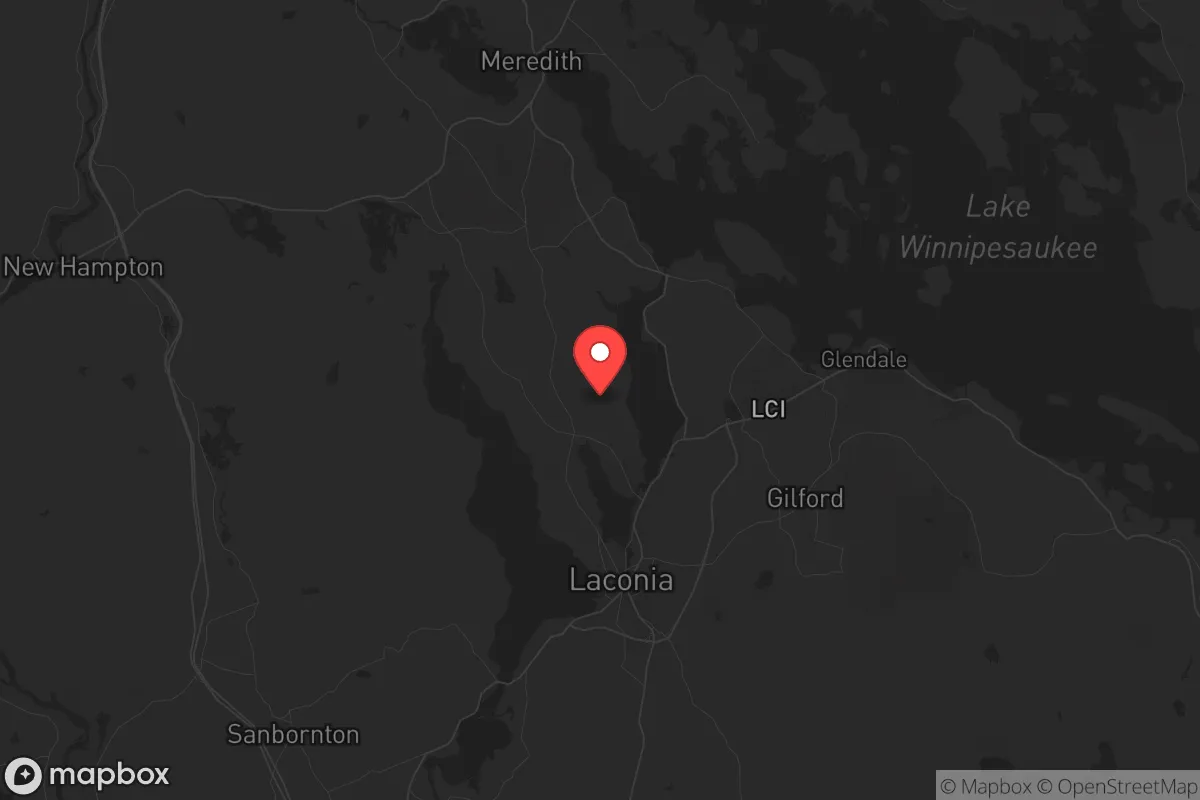
Demographics of Laconia, NH
Affluence Level in Laconia, NH
A middle-class area roughly in line with national averages across income, home values, education, and employment.
People of Laconia, NH
The people of Laconia, New Hampshire, today number 16,982, forming a predominantly white (90.4%) and notably homogenous community in the state’s Lakes Region. With a foreign-born population of just 0.6% and a college attainment rate of 25.3%, the city retains a working-to-middle-class character rooted in its industrial and tourism past. Its identity is shaped by a deep sense of local history, seasonal population swells from lakefront visitors, and a demographic stability that sets it apart from faster-changing parts of the state.
How the city was settled and grew
Laconia’s population history begins with European settlers drawn to the area’s water power and timber resources in the late 18th century. The original settlement clustered around the Winnipesaukee River, where mills harnessed falls for grist and lumber. By the mid-19th century, the arrival of the railroad and the rise of the knitting industry—particularly the Laconia Car Company and later the Belknap Mills—brought waves of French-Canadian and Irish immigrants. These groups built their homes in distinct neighborhoods: French-Canadian families concentrated in The Weirs (the historic village on Lake Winnipesaukee) and the Lakeport district, while Irish laborers settled near the mills along the river in what is now Downtown Laconia. A smaller wave of Italian and Polish immigrants arrived in the early 1900s, settling in the Brickyard area near the industrial rail yards. By 1950, Laconia’s population had reached roughly 14,000, with the city’s economy pivoting from textiles to tourism and light manufacturing.
Modern era (post-1965)
After the 1965 Immigration Act, Laconia saw almost no new foreign-born influx—the foreign-born share today is just 0.6%, one of the lowest in New Hampshire. Instead, the city’s modern demographic story is one of domestic in-migration and suburbanization. From the 1970s through the 1990s, families from southern New Hampshire and Massachusetts moved to Laconia for lower housing costs and lake access, settling in newer subdivisions like Gilmanton Corner (on the city’s eastern edge) and Opechee Park (a lakefront neighborhood of seasonal and year-round homes). The Hispanic population, now at 3.2%, grew slowly through the 2000s, largely from Puerto Rican and Mexican families working in hospitality and construction; they are dispersed across the city, with a small cluster near the Downtown commercial corridor. East and Southeast Asian residents (1.5%) are mostly second- and third-generation families who arrived via Boston or Manchester, living in the Lakeport and Weirs Beach areas. The Black population remains at 0.0%, and the Indian-subcontinent population at 0.0%, reflecting the city’s continued lack of diversity relative to the state average.
The future
Laconia’s population is projected to remain stable or grow modestly, driven by domestic migration from more expensive parts of New England rather than international immigration. The city is not homogenizing further—it is already near the ceiling of demographic uniformity—but it is also not tribalizing into distinct ethnic enclaves. The small Hispanic and Asian communities are assimilating into existing neighborhoods rather than forming concentrated blocks. The biggest demographic shift ahead is age-related: Laconia has a median age of 44, and the retirement of baby boomers is likely to attract younger families seeking affordable lakefront property, particularly in The Weirs and Opechee Park. The foreign-born share will likely remain below 2% for the next decade, as the city lacks the job base or housing stock to draw significant international migration.
For someone moving in now, Laconia offers a stable, culturally traditional community where the population is aging but not shrinking, and where the social fabric is woven from generations of the same families. The city is becoming a quieter, more residential version of its former industrial self—a place where newcomers are welcomed, but the pace of change is slow and the demographic profile will look very similar in 2035 to what it does today.
* Values derived from national, state, county, city and local statistics and may differ in a specific area. Last updated: 2026-05-01T20:38:10.000Z
Narrative content on this page is AI-generated and may contain mistakes. Verify any details that matter before acting on them.
ReloMaps may earn a commission from affiliate links at no extra cost to you.