Photo: Wikipedia
Quality of Life in Lenexa, KS
A high quality of life with strong walkability, manageable living costs, healthy neighborhood signals, and solid amenity access.
What does Quality of Life tell us?
Quality of Life blends cost of living, nearby amenities, socioeconomic signals, and neighborhood character. City-level scores represent the whole municipality; individual neighborhoods can differ.
What does this tell us?
Quality of Life blends cost of living, nearby amenities, socioeconomic signals, and neighborhood character. City-level scores represent the whole municipality; individual neighborhoods can differ.
Cost of Living
26% above national average
The Real Cost of Living in Lenexa, KS for 2026
| Tier | Individual | Family (4) |
|---|---|---|
| Survival | $23k | $43k |
| Comfortable | $72k | $105k |
| Luxury | $173k+ | $268k+ |
| Elite (Top 5%) | $203k+ | $315k+ |
97%
The Area Signal
A metric tracking the socioeconomic signals of the area.
Hobbies
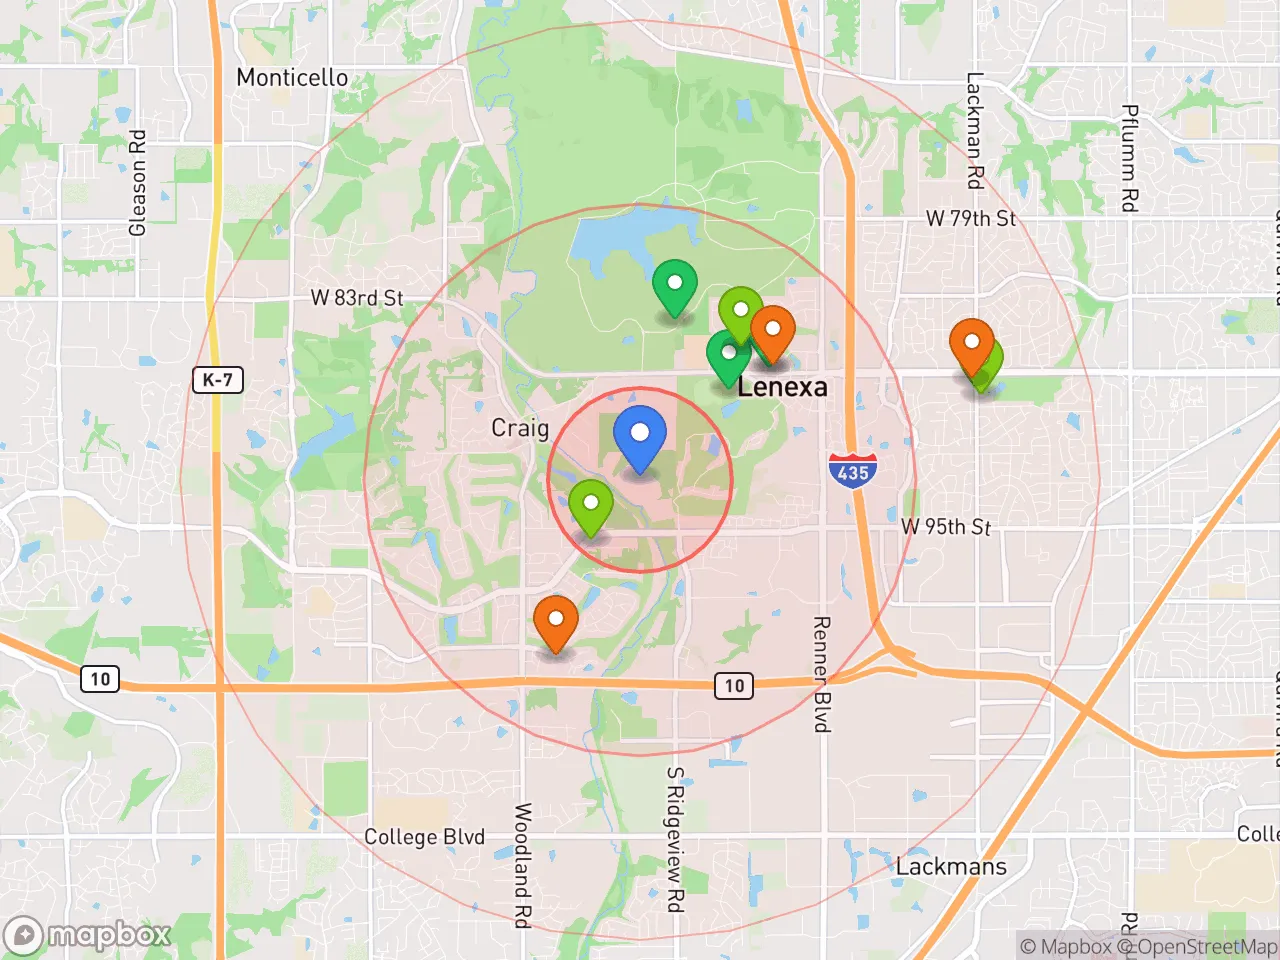
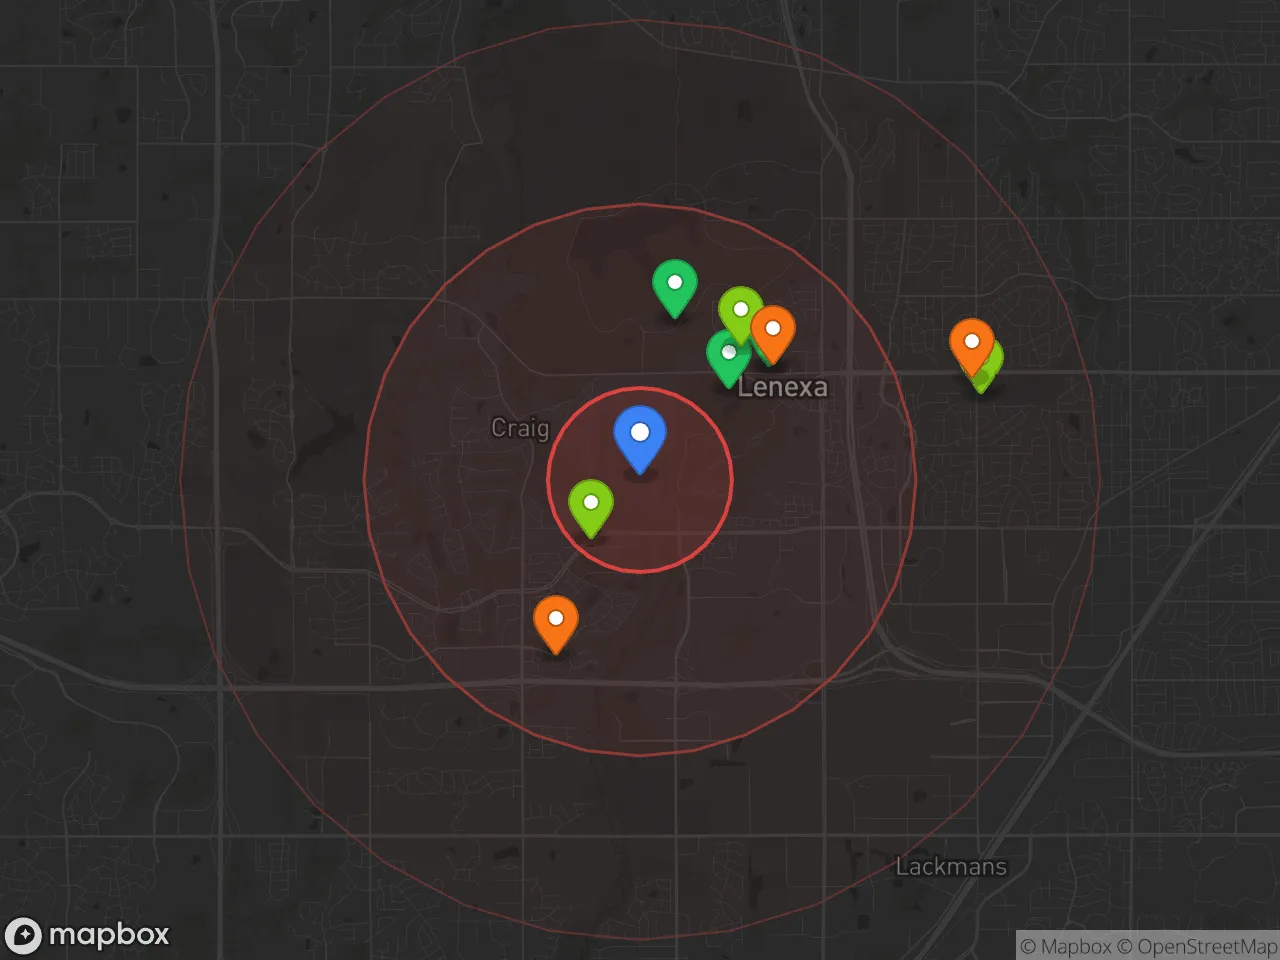
Explore the areaGroceries
6 within 10 miles
Gas
20 within 10 miles
Hospital
20 within 20 miles
Airport
MCI — Kansas City International
Post Office
USPS — Shawnee, KS
Critical Amenities
Quality-of-Life Analysis
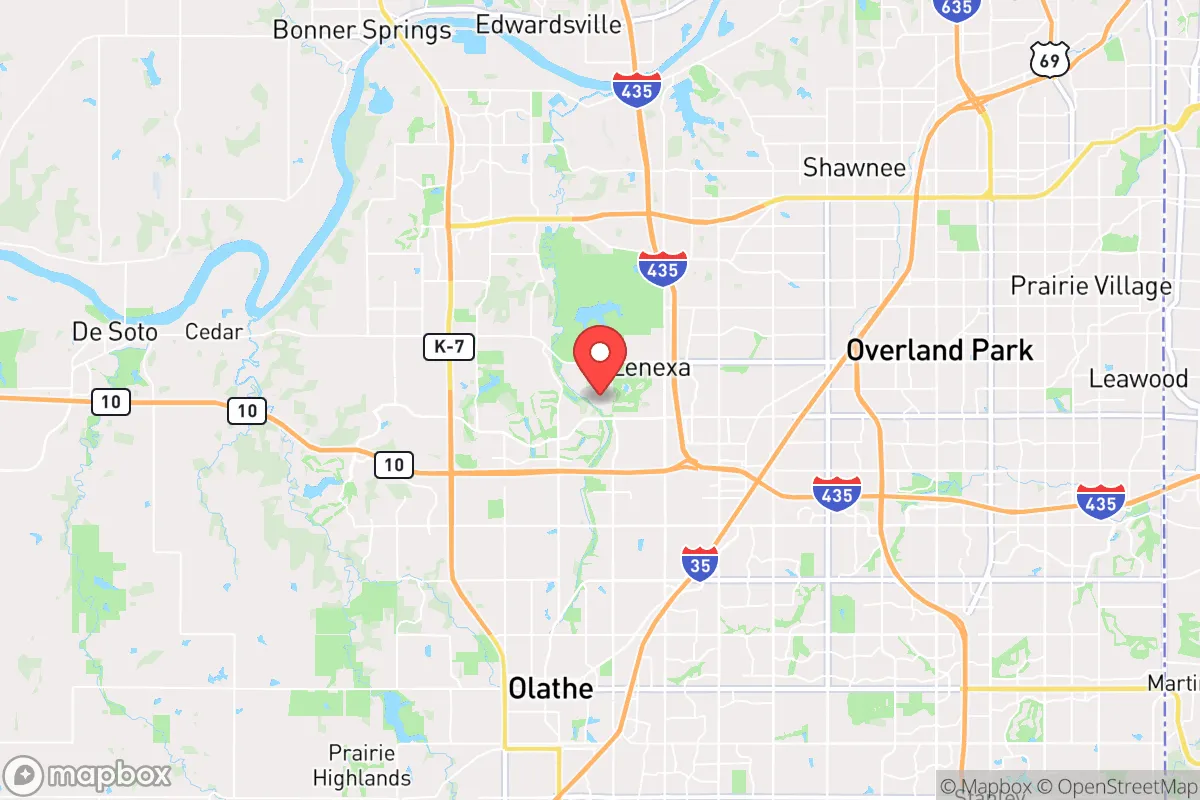
Lenexa, Kansas, is an affluent suburban city in Johnson County where the cost of living index sits at 126 (26% above the U.S. average), reflecting a community of professionals, families, and executives drawn to its high-performing schools and proximity to Kansas City. The population skews educated and white-collar, with a median household income well above the national figure, and the city’s 19.8-minute average commute underscores a lifestyle centered on local employment hubs rather than long-distance regional travel. This is a place where quality of life is measured in school ratings, park access, and short drive times, not nightlife or urban density.
Cost of living, housing, and affordability compared to Overland Park and Kansas City
Lenexa’s housing market is the primary driver of its elevated cost of living. The median home value of $368,800 is roughly 10% higher than the national median but notably lower than in neighboring Overland Park (where medians often exceed $400,000) and significantly above Kansas City, MO (where the median hovers around $200,000). Renters face a median monthly rent of $1,429, which is competitive for Johnson County but about 20% higher than the Kansas City metro average. Property taxes in Johnson County are moderate for the region, though Kansas’s state income tax (a flat 5.7% in 2026) adds a layer of cost that Missouri residents avoid. For buyers, the trade-off is clear: Lenexa offers newer housing stock and lower crime rates than central Kansas City, but at a premium that prices out many first-time buyers. The city’s affordability relative to Overland Park makes it a popular middle-ground choice for families who want Johnson County schools without the top-tier price tag.
What daily life is like for families: schools, parks, and local amenities
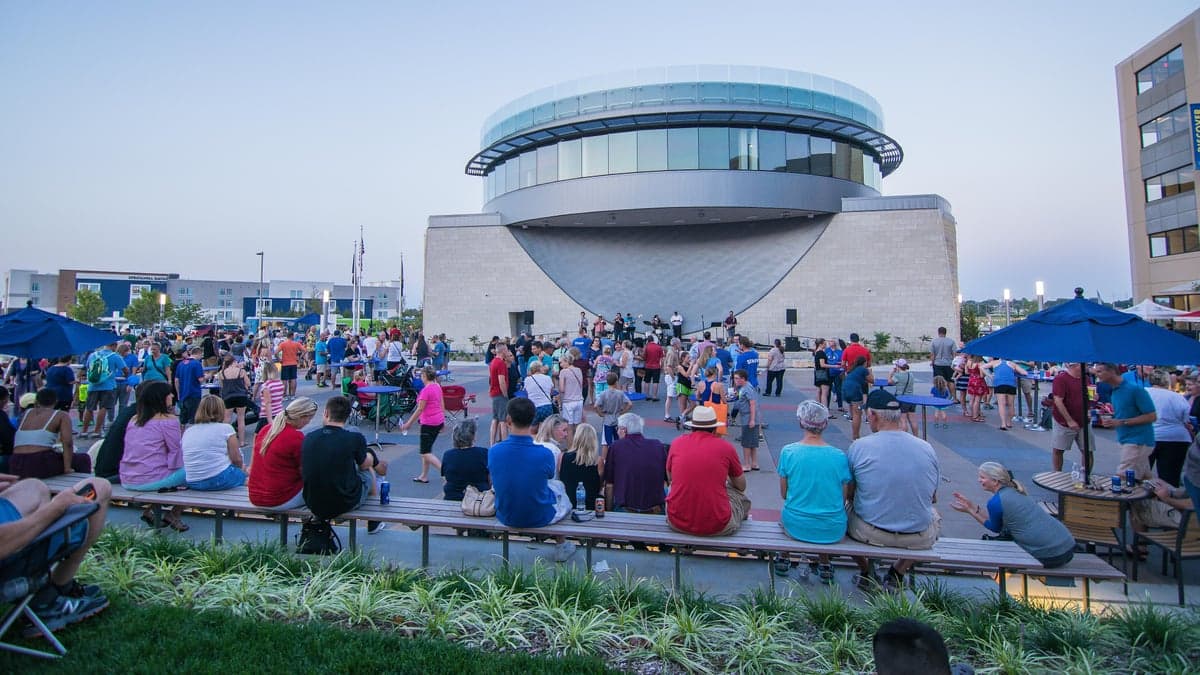
Daily life in Lenexa revolves around its highly rated public schools, part of the Shawnee Mission and Olathe school districts, both of which consistently earn A ratings from Niche and GreatSchools. The city operates over 30 parks, including the 200-acre Sar-Ko-Par Trails Park with its lake, amphitheater, and walking paths, and the Lenexa Rec Center offers indoor pools and fitness classes that anchor community activity. The Lenexa Farmers Market (April–October) and the annual Lenexa Spinach Festival provide seasonal gathering points, while the city’s 19.8-minute average commute means most residents work within Johnson County or northern Kansas City, reducing time spent in traffic. Retail and dining cluster along I-35 and 87th Street Parkway, with national chains and local spots like the Lenexa Public Market (a food hall with rotating vendors). The city lacks a true downtown core, but its master-planned neighborhoods and office parks create a predictable, low-crime environment that appeals strongly to families with school-age children.
Lenexa is best suited for professionals and families who prioritize school quality, short commutes, and suburban safety over urban energy or walkability. Singles and young renters may find the social scene limited compared to Kansas City’s Crossroads district, and the high cost of housing can be a barrier for lower-income households. However, for those who value predictable routines, strong public services, and a community where most neighbors are homeowners with similar life stages, Lenexa delivers a quality of life that justifies its above-average cost. The city’s steady population growth and low vacancy rates suggest that this formula continues to attract the same demographic year after year.
Crime in Lenexa, KS
Generally safer than 63% of comparable U.S. locations.
Violent CrimeViolent Crime Analysis
Property CrimeProperty Crime Analysis
Crime Analysis
Lenexa, Kansas, presents a mixed safety profile for prospective residents. While its violent crime rate of 389.4 incidents per 100,000 people is notably lower than the national average, its property crime rate of 1,587.4 per 100,000 is significantly higher, placing it above both state and national benchmarks. This combination means that while the risk of a violent encounter is below typical U.S. levels, the likelihood of experiencing theft, burglary, or vehicle-related crime is a tangible concern, particularly given the broader criminal justice environment in the Kansas City metropolitan area.
Crime in context
Lenexa’s violent crime rate is roughly 20% lower than the national average of approximately 500 per 100,000, a positive indicator for a suburban city of its size. However, the property crime rate is about 30% higher than the national average of roughly 1,200 per 100,000. This disparity is common in suburbs of large metro areas like Kansas City, where property crime often spills over from urban cores. A critical factor for readers to weigh is the prevailing progressive judicial philosophy in Johnson County and the broader metro region. District attorneys and judges who prioritize rehabilitation and lenient sentencing for property and non-violent offenders can create a revolving-door effect, emboldening repeat criminals and undermining public confidence in the justice system. This ideological approach, while well-intentioned, directly contributes to higher property crime rates by reducing the deterrent effect of prosecution.
What residents experience
For daily life in Lenexa, the practical impact of these crime rates is uneven. Violent crime—such as assault, robbery, and homicide—is relatively rare and tends to be concentrated in specific, often transient, areas. Most residents report feeling safe walking their neighborhoods during the day. The primary frustration is property crime: vehicle break-ins, package theft, and garage burglaries are common complaints on neighborhood social media groups. The presence of major retail corridors like 87th Street Parkway and the Lenexa City Center area creates attractive targets for organized retail theft rings, which are often treated with leniency under progressive prosecution policies. This means a stolen catalytic converter or a smashed car window is a realistic risk, even in otherwise quiet subdivisions.
Neighborhood-level variation is significant. Older, established neighborhoods with active homeowners associations and private security patrols, such as those near Sar-Ko-Par Trails Park, tend to report lower property crime. In contrast, areas closer to Interstate 35 and the Johnson County border with Kansas City, Kansas, see higher rates of transient-related theft and vehicle crime. Prospective residents should consult the Lenexa Police Department’s online crime mapping tool and look specifically at block-level data for theft and burglary over the past 12 months. The combination of a low violent crime rate but elevated property crime, exacerbated by a lenient local justice system, means Lenexa requires a pragmatic approach to home security and personal property protection.
* Values derived from national, state, county, city and local statistics and may differ in a specific area. Last updated: 2026-04-30T05:13:29.000Z
Narrative content on this page is AI-generated and may contain mistakes. Verify any details that matter before acting on them.
ReloMaps may earn a commission from affiliate links at no extra cost to you.