Photo: Wikipedia
Demographics of Mitchell, SD
Affluence Level in Mitchell, SD
A middle-class area roughly in line with national averages across income, home values, education, and employment.
People of Mitchell, SD
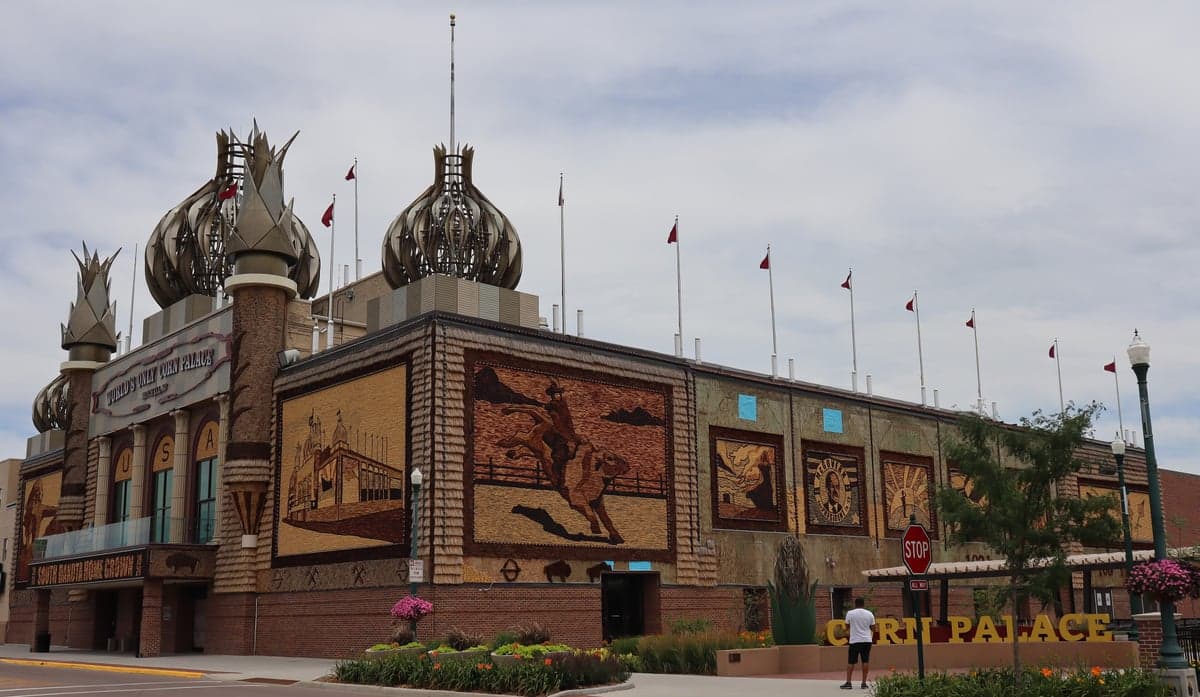
The people of Mitchell, South Dakota, today number 15,637 and form a predominantly white, native-born community with a strong agricultural and small-town identity. The city’s population is 88.0% white, with a Hispanic share of 5.3% and a foreign-born rate of just 1.4%, reflecting limited recent immigration. Mitchell’s distinctive character is rooted in its role as a regional trade and education hub, anchored by Dakota Wesleyan University and the iconic Corn Palace, which draws visitors and reinforces a proud, self-reliant civic culture. The population is older and less college-educated (25.7%) than national averages, but remains stable, with slow growth driven by domestic in-migration from surrounding rural areas.
How the city was settled and grew
Mitchell was founded in 1879 as a railroad town on the Chicago, Milwaukee, St. Paul and Pacific line, which opened the region to homesteaders under the Homestead Act. The original settlers were predominantly Northern European immigrants—Germans, Norwegians, and Swedes—who claimed land for wheat and corn farming. These groups built the core of the city around the railroad depot and Main Street, with early neighborhoods like West End (west of Main Street) and North Mitchell (north of the tracks) housing the first wave of laborers and merchants. The city’s growth accelerated after 1892 with the construction of the Corn Palace, which promoted the region’s agricultural bounty and drew seasonal workers and traders. By the 1920s, a second wave of German-Russian immigrants arrived, settling in South Mitchell near the stockyards and grain elevators, where they worked in meatpacking and grain handling. The population peaked at around 14,000 by 1960, with the city remaining overwhelmingly white and native-born, as the railroad and agriculture sectors provided stable employment.
Modern era (post-1965)
After the 1965 Hart-Cellar Act, Mitchell saw minimal immigration, unlike larger Midwestern cities. The foreign-born share remains at 1.4%, with the small Hispanic population (5.3%) concentrated in East Mitchell, near the industrial parks and the Lake Mitchell area, where a few families work in construction and food processing. The Asian population (0.7%) is mostly East/Southeast Asian, with a handful of Hmong and Vietnamese families who arrived in the 1980s as secondary migrants from larger cities; they live scattered across West End and near the Dakota Wesleyan campus. The Black population (0.4%) is tiny and largely transient, tied to seasonal agricultural work or the university. Domestic in-migration since 1970 has been primarily from rural Davison County and adjacent counties, as younger families move to Mitchell for its schools and healthcare jobs. Suburbanization occurred in the Lake Mitchell area and Northridge subdivision (north of Highway 37), where newer, larger homes attracted professionals and retirees. The city’s racial composition has barely shifted: white share dropped only from 96% in 1990 to 88% today, with the Hispanic increase accounting for most of the change. The Indian-subcontinent population is effectively zero.
The future
Mitchell’s population is projected to remain stable or grow slowly, reaching roughly 16,000 by 2040, driven by natural increase and continued rural-to-urban migration within South Dakota. The Hispanic share may rise to 8-10% as families in East Mitchell grow and attract chain migration from other Plains states, but the foreign-born rate will likely stay below 3%. The white population will remain dominant, though aging—the median age is 39.5, above the state average—which could slow growth as older residents move to warmer climates. The city is not tribalizing into distinct ethnic enclaves; instead, it is homogenizing around a white, native-born core, with small Hispanic and Asian communities assimilating into existing neighborhoods like West End and South Mitchell. The next decade will likely see continued expansion of Northridge and Lake Mitchell subdivisions, attracting families from the region, while the historic core of North Mitchell may see reinvestment as a walkable district for young professionals.
Mitchell is becoming a slightly more diverse but still overwhelmingly white, stable, and family-oriented community, where newcomers—especially those from rural backgrounds—will find a familiar, low-crime environment with strong schools and a tight-knit social fabric. For a conservative-leaning individual or parent, the city offers continuity and predictability, with demographic change occurring slowly and without significant cultural friction.
* Values derived from national, state, county, city and local statistics and may differ in a specific area. Last updated: 2026-05-02T05:34:42.000Z
Narrative content on this page is AI-generated and may contain mistakes. Verify any details that matter before acting on them.
ReloMaps may earn a commission from affiliate links at no extra cost to you.