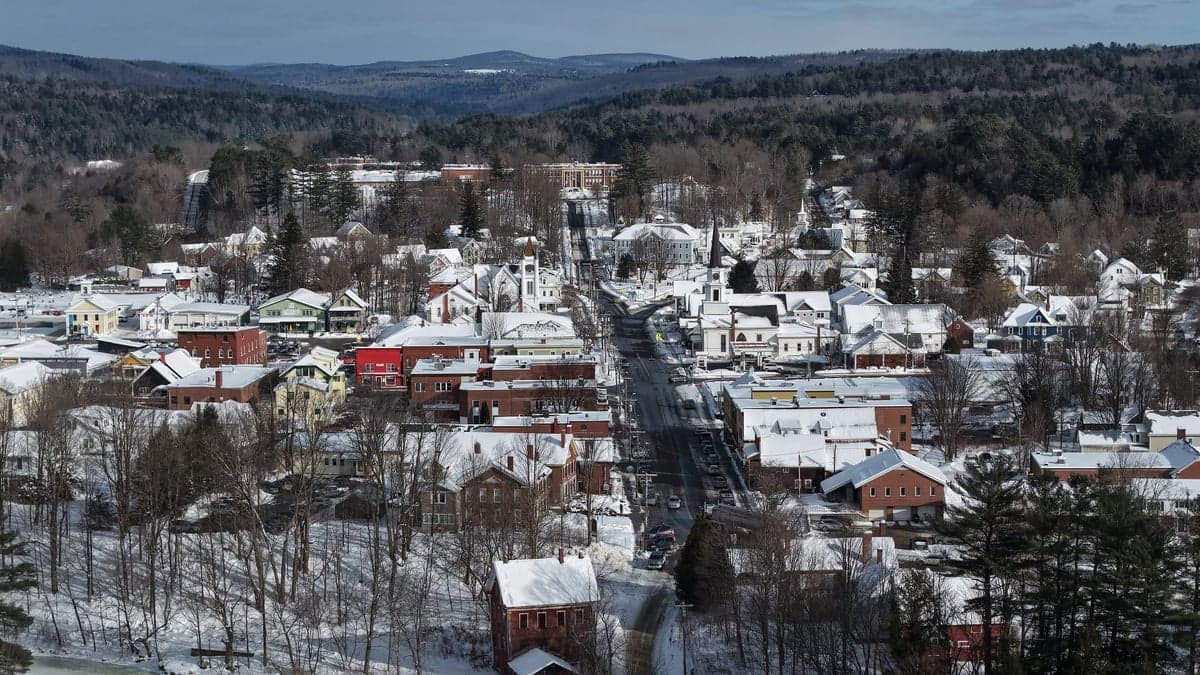
Photo: Wikipedia
Demographics of Morrisville, VT
Affluence Level in Morrisville, VT
A middle-class area roughly in line with national averages across income, home values, education, and employment.
People of Morrisville, VT
Morrisville, Vermont, is a small, predominantly white community of 2,527 residents where 88.1% of the population identifies as white alone. The village maintains a working-class, rural character with a 32.6% college-educated rate, and its foreign-born population sits at just 2.2%, well below the national average. The people of Morrisville today are largely descendants of 19th-century Yankee settlers and 20th-century French-Canadian mill workers, with a small but visible East/Southeast Asian community (1.9%) and a Hispanic population (3.6%) that has grown modestly in recent years. This is a place where family roots run deep, and newcomers—whether from other parts of Vermont or out of state—often note the tight-knit, insular social fabric.
How the city was settled and grew
Morrisville was chartered in 1790 as part of the town of Morristown, with the first permanent settlers arriving from southern New England around 1796. These early families—mostly of English and Scottish descent—cleared land for subsistence farming along the Lamoille River, clustering in what is now the Lower Village district near the river crossing. The arrival of the Vermont Central Railroad in 1849 transformed Morrisville from a farming hamlet into a mill town. By the 1870s, the village’s Mill District (centered on Portland Street and the river) housed sawmills, gristmills, and a woolen mill that drew Irish immigrants fleeing the Great Famine and, later, French-Canadian families migrating south from Quebec. The French-Canadian wave, peaking between 1880 and 1920, settled heavily in the North End around Brooklyn Street and the area near St. John’s Catholic Church, building a distinct Franco-American neighborhood with its own parish, school, and social clubs. A smaller wave of Italian laborers arrived around 1900 to work on railroad maintenance and quarry stone, settling in the South End near the rail yards. By 1930, Morrisville’s population was roughly 60% Yankee Protestant and 35% French-Canadian Catholic, with the remainder a mix of Irish, Italian, and a handful of Eastern European families.
Modern era (post-1965)
After the Hart-Cellar Act of 1965, Morrisville saw virtually no new immigration from Asia, Africa, or Latin America for decades. The foreign-born share remained below 1% through the 1990s. Instead, the village’s post-1965 demographic story is one of domestic in-migration: back-to-the-land hippies in the 1970s, followed by second-home buyers and remote workers from Massachusetts, New York, and Connecticut beginning in the 2000s. These newcomers concentrated in the Elmore Mountain Road corridor and the West Hill area, where larger lots and mountain views attracted out-of-state buyers. The Mill District and North End remained predominantly French-Canadian and working-class, while the Lower Village saw a mix of long-term locals and newer residents renovating historic homes. The East/Southeast Asian population (1.9%) is almost entirely composed of a small number of Vietnamese and Korean families who arrived in the 1980s and 1990s, many connected to the nearby University of Vermont or Copley Hospital; they are scattered across the village rather than forming a distinct ethnic enclave. The Hispanic population (3.6%) has grown since 2010, driven by Mexican and Central American workers in the dairy and maple syrup industries; these families tend to rent in the South End and Mill District, where housing is cheaper. The Black population remains 0.0%, and there are no recorded Indian-subcontinent or Arab residents.
The future
Morrisville’s population is aging and slowly shrinking, with a median age of 43.5 and a birth rate below replacement. The village is not homogenizing into a single identity; rather, it is tribalizing into three distinct groups: old-stock Vermonters (Yankee and French-Canadian) concentrated in the North End and Mill District, out-of-state transplants in West Hill and Elmore Mountain Road, and a small but growing Hispanic workforce in the South End. The East/Southeast Asian community is plateauing, with younger adults leaving for Burlington or out of state after high school. The Hispanic population is likely to grow slowly as dairy farms continue to rely on immigrant labor, but Morrisville lacks the housing stock and social infrastructure to absorb rapid growth. Over the next 10–20 years, expect the village to become slightly more Hispanic (perhaps 5–6%) and slightly less white, but to remain overwhelmingly native-born and rural in character. The out-of-state transplant share will probably increase as remote work persists, driving up home prices and accelerating the displacement of younger locals.
For a conservative-leaning individual or family moving to Morrisville now, the bottom line is this: you are entering a community that is still culturally Yankee and French-Canadian, with a strong sense of local identity, low crime, and minimal ethnic diversity. The village is not becoming a multicultural hub, but it is quietly diversifying along class and geographic lines—old-timers versus newcomers, locals versus second-home owners. If you value stability, self-reliance, and a place where neighbors know each other’s names, Morrisville will feel familiar. If you expect rapid growth or significant demographic change, you will find a village that has changed little in 50 years and intends to stay that way.
* Values derived from national, state, county, city and local statistics and may differ in a specific area. Last updated: 2026-04-23T11:42:46.000Z
Narrative content on this page is AI-generated and may contain mistakes. Verify any details that matter before acting on them.
ReloMaps may earn a commission from affiliate links at no extra cost to you.