Photo: Wikipedia
Demographics of Newnan, GA
Affluence Level in Newnan, GA
A middle-class area roughly in line with national averages across income, home values, education, and employment.
People of Newnan, GA
The people of Newnan, Georgia, today number 43,510 and form one of the most demographically balanced midsize cities in the Atlanta metropolitan area, with a near-even split between White (48.6%) and Black (34.0%) residents and a growing Hispanic population (8.9%). The city’s identity is shaped by its dual character as a historic county seat with deep Southern roots and a rapidly suburbanizing exurb drawing families from metro Atlanta. With 39.8% of adults holding a college degree, Newnan’s population is notably more educated than the national average for cities its size, reflecting the influx of professionals seeking lower housing costs and good schools within commuting distance of Hartsfield-Jackson Atlanta International Airport.
How the city was settled and grew
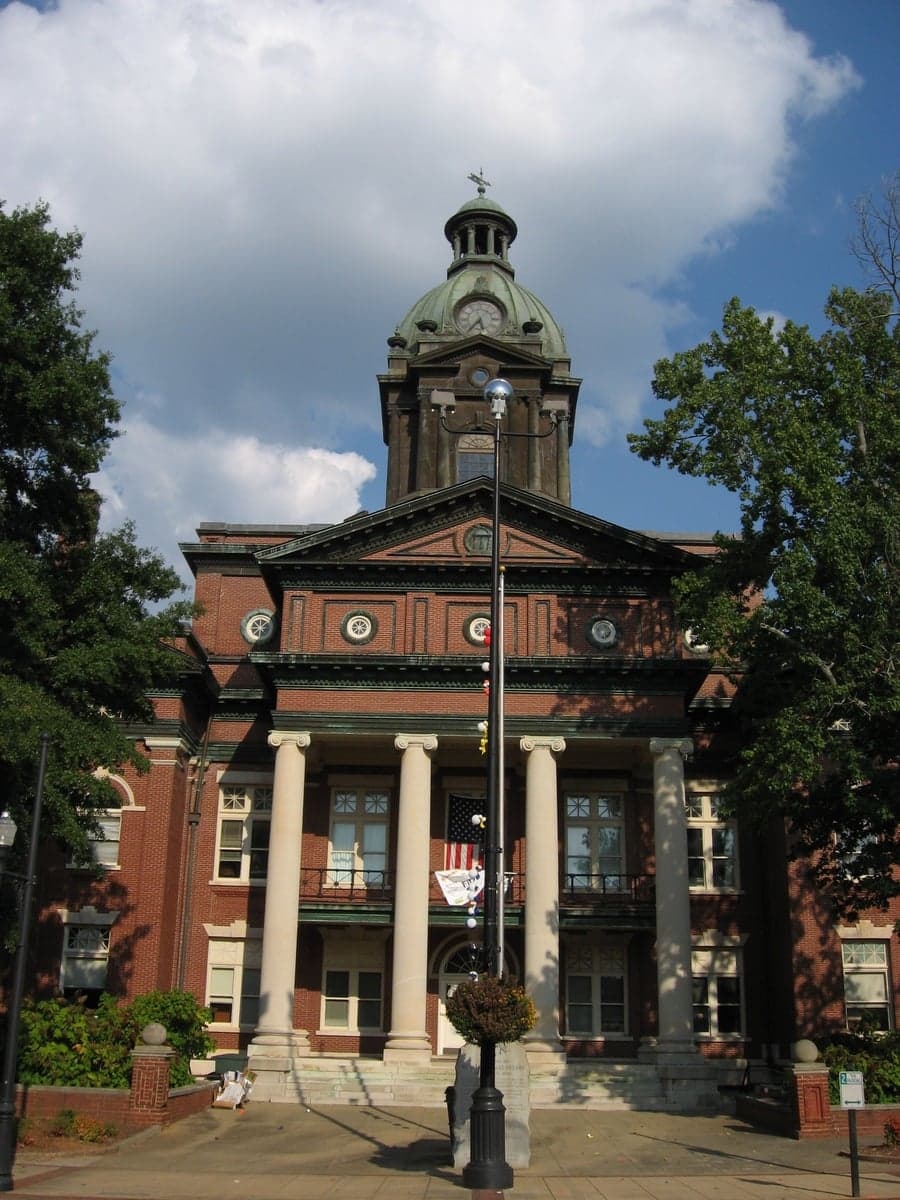
Newnan was founded in 1828 as the seat of Coweta County, carved from Creek Indian territory ceded in the 1825 Treaty of Indian Springs. The original settlers were primarily yeoman farmers and small planters from the Upper South—Virginia, North Carolina, and upcountry South Carolina—who moved into the Georgia Piedmont for cotton land. The city’s historic core, Downtown Newnan, was built by these early Anglo-American settlers and retains its antebellum commercial architecture. After the Civil War, the local economy shifted from cotton to textile manufacturing, drawing a wave of rural White and Black workers into mill villages. The Greenville Street corridor and the Northside neighborhood became home to the city’s Black population, many of whom worked in the mills or as domestic laborers. By 1900, Newnan was a segregated but economically diverse town of roughly 4,000, with distinct Black and White residential zones that persisted through the Jim Crow era. The post-World War II period brought modest growth as returning veterans and their families settled in new subdivisions like East Newnan, but the city remained a relatively sleepy county seat until the 1990s.
Modern era (post-1965)
The 1965 Hart-Cellar Immigration Act had little immediate effect on Newnan, which remained overwhelmingly Black and White through the 1980s. The real demographic transformation began in the mid-1990s, when Atlanta’s explosive suburban growth pushed development south along Interstate 85. Newnan became a bedroom community for commuters working at the airport, at Delta Air Lines headquarters, and in the industrial parks of south Fulton County. This wave brought a predominantly White, college-educated population into master-planned subdivisions such as SummerGrove and Canongate, which today anchor the city’s western and southern edges. At the same time, the city’s historic Black neighborhoods—Lucky Street and the Westside—saw outmigration of younger families to newer subdivisions, while remaining culturally significant. The Hispanic population, now 8.9%, began growing in the 2000s, concentrated in the Newnan Crossing area and along the Highway 34 corridor, drawn by construction and service jobs. The East/Southeast Asian community (2.7%) and Indian-subcontinent community (1.3%) are smaller but visible, with families settling in the newer subdivisions near the Newnan Pavilion shopping center. The foreign-born share of 5.7% is below the national average but has doubled since 2000, driven primarily by Hispanic and Asian immigration.
The future
Newnan’s population is projected to continue growing at 2–3% annually, driven by domestic in-migration from higher-cost metro Atlanta counties and from other states. The city is not homogenizing into a single demographic bloc; instead, it is tribalizing into distinct enclaves. The western subdivisions (SummerGrove, Canongate) remain overwhelmingly White and affluent, while the historic core and east side retain a strong Black middle-class presence. The Hispanic community is growing steadily but not explosively, and is beginning to assimilate into the broader population as second-generation residents move into mixed neighborhoods. The East/Southeast Asian and Indian communities are small but stable, with no signs of rapid growth or decline. Over the next 10–20 years, Newnan will likely become slightly more diverse at the margins—Hispanic share may reach 12–14%, and Asian/Indian shares may edge toward 5% combined—but the city’s fundamental character as a balanced Black-White exurb with a modest Hispanic minority will persist. The college-educated share will continue rising as remote work and airport-adjacent employment draw more professionals.
For someone moving in now, Newnan offers a rare demographic equilibrium in metro Atlanta: a place where no single group dominates, where historic Black neighborhoods coexist with new White subdivisions, and where the schools and housing market reflect this balance. The city is becoming more educated and more suburban, but it remains grounded in its Southern small-town roots, with a population that is neither homogenizing nor fragmenting into isolated camps.
* Values derived from national, state, county, city and local statistics and may differ in a specific area. Last updated: 2026-04-30T05:08:50.000Z
Narrative content on this page is AI-generated and may contain mistakes. Verify any details that matter before acting on them.
ReloMaps may earn a commission from affiliate links at no extra cost to you.