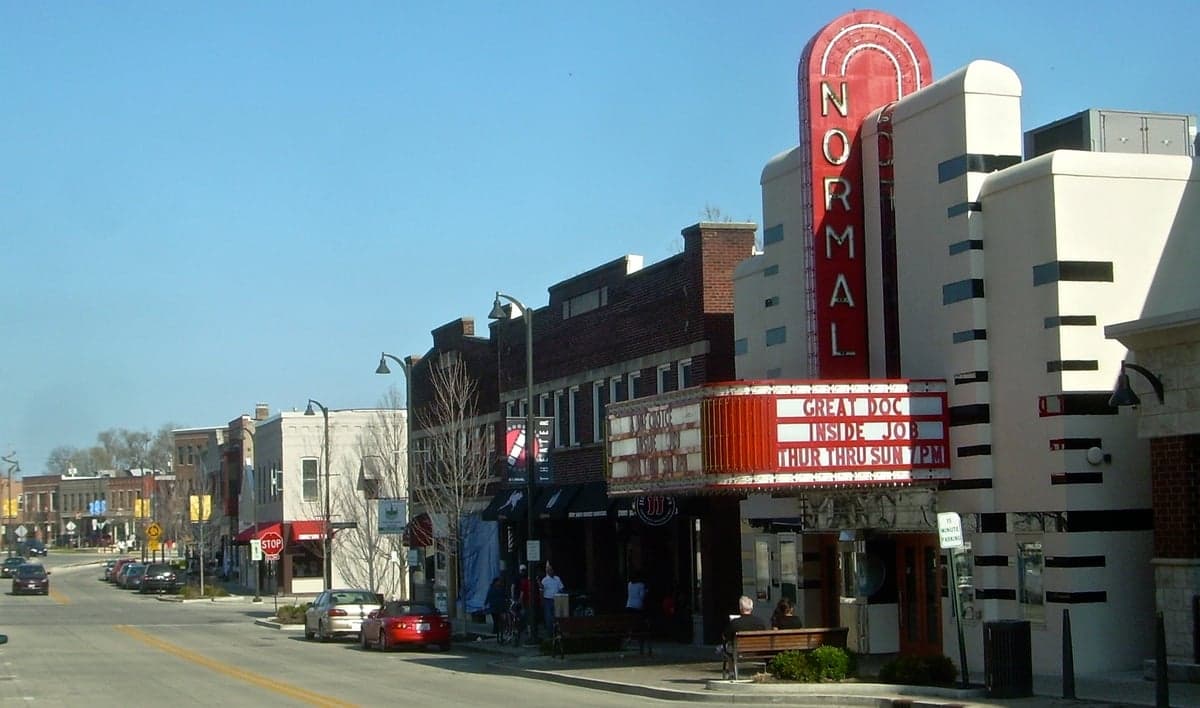
Photo: Wikipedia
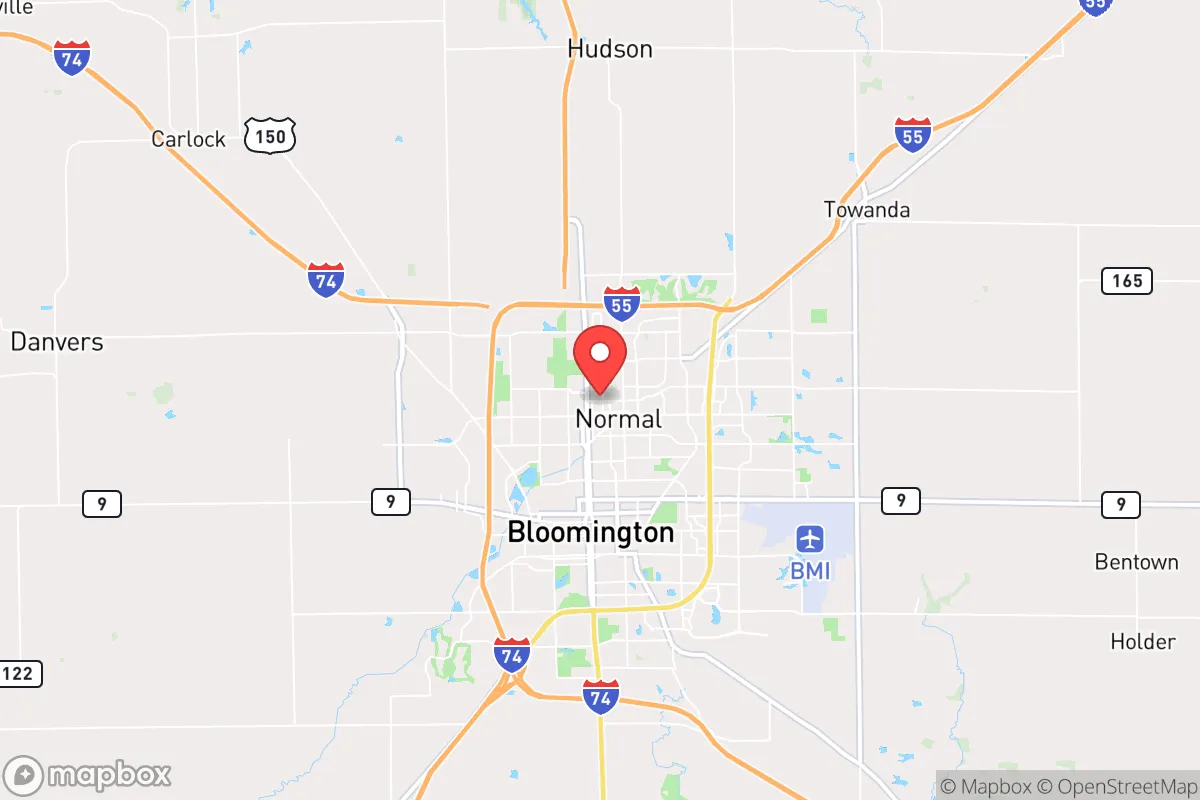
Demographics of Normal, IL
Affluence Level in Normal, IL
A middle-class area roughly in line with national averages across income, home values, education, and employment.
People of Normal, IL
The people of Normal, Illinois today form a college town of 52,908 residents with a notably high educational attainment—52.5% hold a bachelor’s degree or higher—driven by Illinois State University’s presence. The population is 75.4% white, 11.4% Black, 7.0% Hispanic, 2.0% East/Southeast Asian, and 1.9% Indian (subcontinent), with only 3.6% foreign-born. Distinctive identity markers include a stable, family-oriented character shaped by university employment, healthcare at OSF HealthCare St. Joseph Medical Center, and a growing professional-services sector, all set within a grid of quiet, tree-lined neighborhoods.
How the city was settled and grew
Normal was founded in 1854 as a railroad town on the Chicago & Alton line, named after the Illinois State Normal University (now Illinois State University) established in 1857. The original population was overwhelmingly native-born white settlers from the Ohio River Valley and New England, drawn by cheap farmland and the promise of a state teachers’ college. The first wave of growth came in the 1870s–1890s as the university expanded, attracting faculty and students who built homes in the Uptown Normal district—the historic core around the campus—and the adjacent East Grove neighborhood, where Victorian-era houses still line the streets. A second wave arrived in the 1910s–1930s with the rise of the Corn Belt railroad hub and local manufacturing (e.g., the Normal Foundry), drawing German and Irish laborers who settled in the West Side near the rail yards. By 1950, the population was nearly 100% white, with a small Black community (under 2%) concentrated near the university’s service-worker housing in the North Normal area.
Modern era (post-1965)
After the 1965 Hart-Cellar Act, Normal’s foreign-born share remained low (3.6% today), but domestic migration reshaped the city. The 1970s–1990s saw suburban-style growth as Illinois State University expanded enrollment, drawing middle-class white families to planned subdivisions like Eagle Ridge (southwest Normal) and Towanda Creek (northwest). The Black population grew from 2% in 1970 to 11.4% today, largely through in-migration from Chicago and downstate Illinois, settling in the University Park area near campus and in older rental stock around the Village Green complex. Hispanic residents (7.0%) arrived primarily in the 2000s–2010s, working in construction and food service, and concentrated in the West Side near the rail corridor and in apartment clusters off College Avenue. East/Southeast Asian residents (2.0%) are mostly university-affiliated faculty and graduate students living in the Uptown and East Grove areas, while the Indian-subcontinent community (1.9%) is similarly tied to ISU’s engineering and business programs, with a visible cluster in the Eagle Ridge subdivisions. The city’s racial geography remains moderately segregated by income: white families dominate the newer subdivisions, while Black and Hispanic residents are more concentrated in older, lower-cost neighborhoods near the university and rail corridor.
The future
Normal’s population is projected to grow slowly (0.3–0.5% annually) through 2040, driven by university enrollment stability and healthcare expansion. The city is not homogenizing but rather tribalizing into distinct enclaves: the white share is declining gradually (from 82% in 2000 to 75.4% today), while Hispanic and Black shares are rising. The foreign-born share is plateauing at 3–4%, with little new immigration beyond university-linked professionals. The East/Southeast Asian and Indian communities are likely to remain small and assimilated into the university orbit, while the Hispanic population may grow modestly through domestic migration from Texas and the Southwest. The next decade will likely see continued income-based sorting: wealthier families (white and Asian) in Eagle Ridge and Towanda Creek, and lower-income families (Black and Hispanic) in the West Side and North Normal rental corridors. No major ethnic enclave is forming; instead, Normal is becoming a moderately diverse, education-driven town with stable but separate residential zones.
For a conservative-leaning individual or family moving in now, Normal is a safe, well-educated, and politically moderate town (McLean County voted +2 R in 2024) where the university anchors the economy and culture. The population is stable and family-oriented, with low crime and good schools, but the city’s future is one of slow, income-driven sorting rather than rapid change. New arrivals will find a place where neighborhoods reflect lifestyle and budget more than ethnicity, and where the university’s presence ensures a steady flow of educated, professional neighbors.
* Values derived from national, state, county, city and local statistics and may differ in a specific area. Last updated: 2026-04-19T07:08:06.000Z
Narrative content on this page is AI-generated and may contain mistakes. Verify any details that matter before acting on them.
ReloMaps may earn a commission from affiliate links at no extra cost to you.