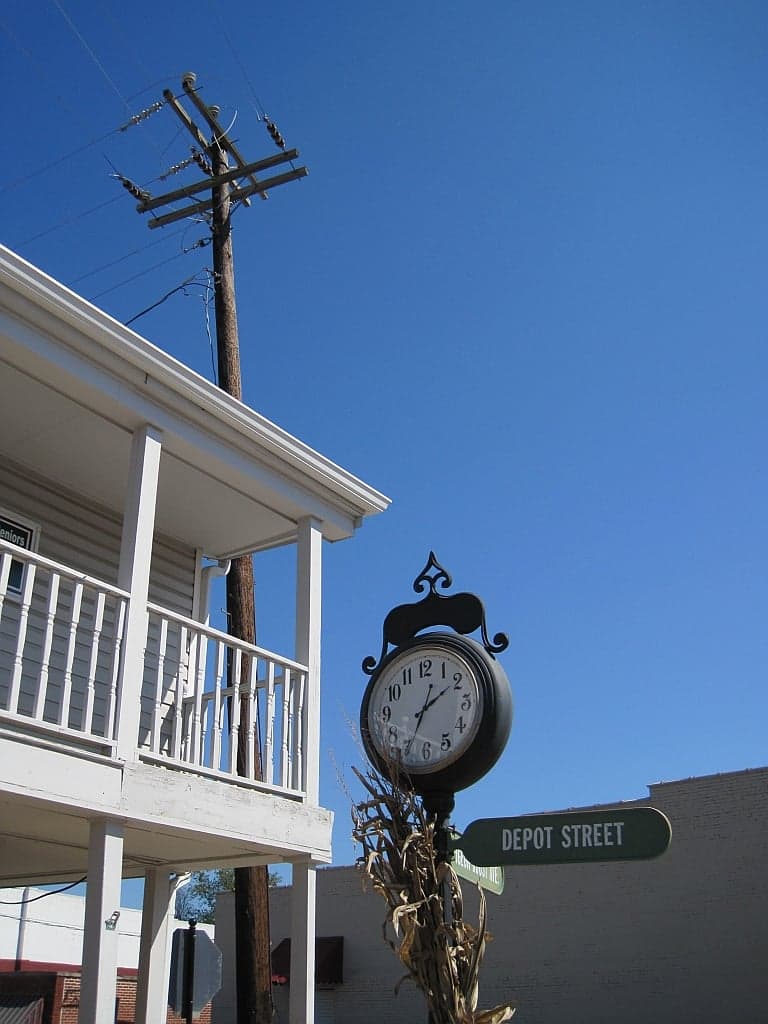
Photo: Wikipedia
Demographics of Olive Branch, MS
Affluence Level in Olive Branch, MS
An upper-middle-class area. Household wealth, education levels, and homeownership run ahead of national benchmarks.
People of Olive Branch, MS
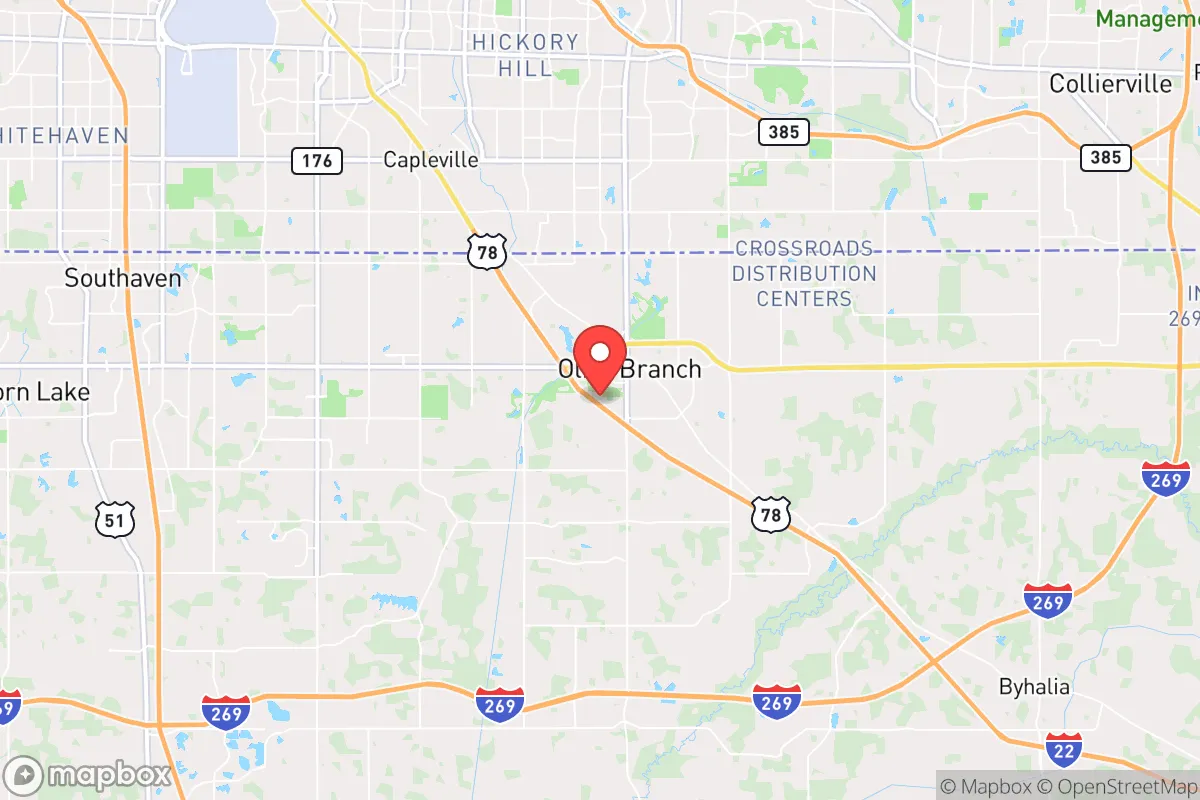
Olive Branch, Mississippi, is a rapidly growing suburban city of 46,538 residents where the population is predominantly White (55.3%) and Black (33.6%), with a small but notable Hispanic (5.6%) and East/Southeast Asian (2.0%) presence. The city’s character is defined by its role as a family-oriented bedroom community for Memphis, Tennessee, just 15 miles north, and its relatively low foreign-born share of just 1.9% reflects a population built primarily through domestic in-migration. Distinctive identity markers include a strong sense of Southern suburban stability, a high rate of homeownership, and a population that is 31.1% college-educated, placing it above the Mississippi state average for educational attainment.
How the city was settled and grew
Olive Branch was originally settled in the 1830s as a small agricultural crossroads in DeSoto County, drawing its first permanent residents—mostly yeoman farmers of English and Scots-Irish descent—who cleared the dense hardwood forests for cotton and corn. The arrival of the Mississippi and Tennessee Railroad in the 1850s transformed the hamlet into a shipping point, and the historic Old Towne Olive Branch district, centered around the original depot, became the commercial and social hub for these early families. By the early 20th century, the population remained overwhelmingly White and rural, with a small Black community concentrated in the Pleasant Hill area, a historically African American settlement established by freedmen after the Civil War who worked as sharecroppers and tenant farmers on surrounding plantations. The city remained a sleepy farming village through the 1950s, with fewer than 1,000 residents, as the railroad declined and the local economy stagnated.
Modern era (post-1965)
The modern transformation of Olive Branch began in earnest after the 1965 Hart-Cellar Act and the broader suburbanization of the Memphis metro area. The completion of Interstate 78 (now I-22) and the expansion of Highway 78 in the 1970s made Olive Branch a viable commuter suburb for Memphis professionals, triggering a wave of White middle-class flight from the city. This domestic in-migration was concentrated in new subdivisions like Briarwood and Bridlewood, which sprouted on former farmland in the 1980s and 1990s, attracting families seeking larger lots and lower taxes than Shelby County, Tennessee. By the 2000s, a second wave of domestic migration brought Black middle-class families from Memphis, drawn by the same suburban amenities and the reputation of the DeSoto County School District. These families settled predominantly in newer developments such as Greenbrook and Pleasant Hill Estates, the latter built adjacent to the historic Pleasant Hill community, creating a corridor of Black homeownership. The Hispanic population, while still small at 5.6%, began to grow in the 2000s, primarily through service-sector employment in construction and hospitality, with a modest cluster forming around the Polk Lane area near the industrial parks. The East/Southeast Asian community (2.0%) is largely composed of Vietnamese and Filipino families who arrived in the 1990s and 2000s, many working in Memphis-area healthcare and manufacturing, and they are dispersed rather than concentrated in a single ethnic enclave. The Indian subcontinent population (0.5%) remains very small, consisting mostly of professionals in technology and medicine who live in newer subdivisions like Hickory Creek.
The future
The population of Olive Branch is heading toward continued growth and gradual diversification, but the pace of change is moderate compared to other Sun Belt suburbs. The city is not homogenizing into a single demographic block; rather, it is tribalizing into distinct, income-segregated enclaves. The older, established subdivisions like Briarwood and Bridlewood remain overwhelmingly White and older (median age above 40), while newer developments like Greenbrook and Pleasant Hill Estates are majority Black and younger (median age in the mid-30s). The Hispanic and East/Southeast Asian communities are growing slowly but steadily, with Hispanic share projected to reach 7-8% by 2035, driven by natural increase and continued service-sector demand. The foreign-born share, however, is likely to remain below 3% as Olive Branch lacks the dense ethnic networks and rental housing stock that attract large immigrant populations. The city’s future is one of a stable, family-oriented suburb where racial and ethnic groups coexist but remain largely separate in their own neighborhoods, with little intergroup mixing outside of schools and retail. For a conservative-leaning individual or parent moving in now, Olive Branch offers a predictable, low-crime environment with strong schools and a population that values homeownership and community stability, but it is not a place of rapid demographic transformation or cultural fusion.
Olive Branch is becoming a mature, settled suburb where the growth of the 1990s and 2000s has given way to infill development and a stable, if segmented, social landscape. For a newcomer, this means a community where the character of your immediate neighborhood will strongly define your experience, and where the city’s overall trajectory is one of gradual, orderly change rather than boomtown flux.
* Values derived from national, state, county, city and local statistics and may differ in a specific area. Last updated: 2026-04-29T22:11:55.000Z
Narrative content on this page is AI-generated and may contain mistakes. Verify any details that matter before acting on them.
ReloMaps may earn a commission from affiliate links at no extra cost to you.