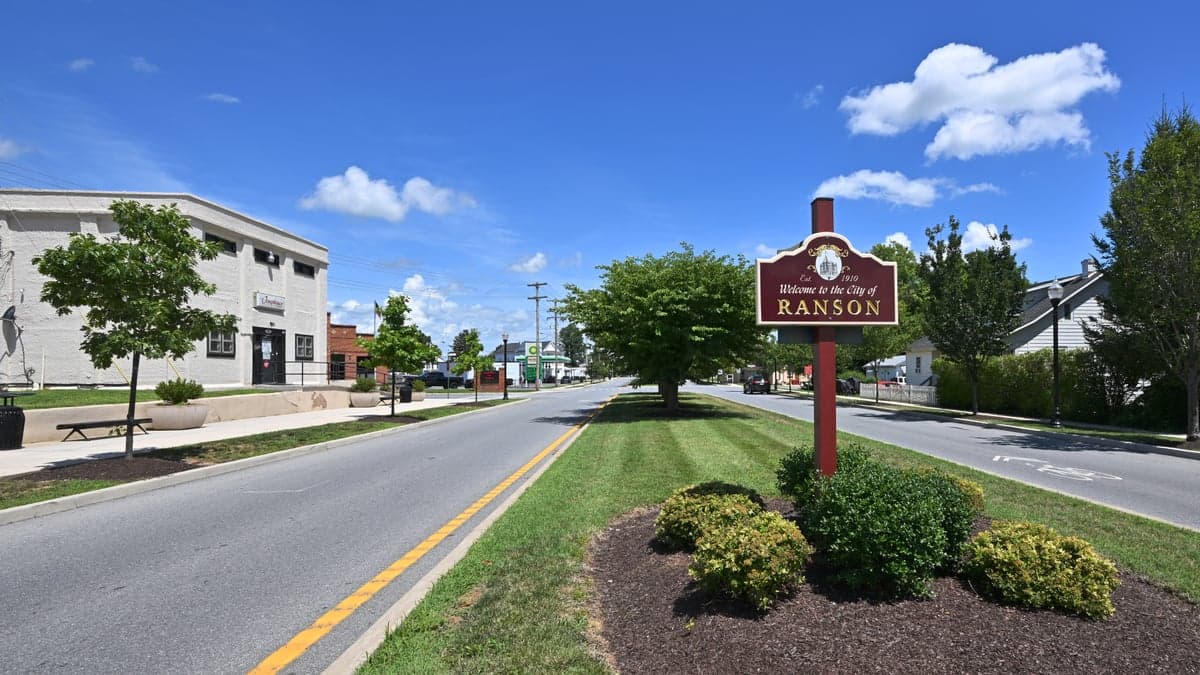
Photo: Wikipedia
Demographics of Ranson, WV
Affluence Level in Ranson, WV
A middle-class area roughly in line with national averages across income, home values, education, and employment.
People of Ranson, WV
Ranson, West Virginia, is a small, dense city of 5,588 residents that blends historic railroad-worker roots with a growing Hispanic and East/Southeast Asian presence. Its population is 71.8% White, 13.9% Hispanic, 6.0% Black, and 4.1% East/Southeast Asian, with 7.1% foreign-born—a notably higher immigrant share than most Jefferson County towns. The city’s identity is shaped by its working-class character, a 15.7% college-educated rate, and a tight-knit feel where old families and newer arrivals share modest single-family homes and rowhouses.
How the city was settled and grew
Ranson was born from the railroad. Founded in 1902 as a planned company town for the Ranson Coal & Iron Company (later part of the Shenandoah Iron Works), the city drew its first wave of workers from European immigrant groups—primarily Irish, Italian, and German laborers who built the furnaces and laid track. These early families settled in the Old Town district, a grid of narrow streets near the Potomac River where company-built rowhouses still stand. By the 1920s, a second wave of Appalachian migrants from rural West Virginia and Virginia arrived, seeking steady industrial wages. They filled the North Ranson neighborhood, a cluster of bungalows and duplexes north of the railroad tracks. The city’s population peaked around 5,000 in the 1950s, sustained by the iron works and later a DuPont plant, but deindustrialization in the 1970s triggered a slow decline as factory jobs vanished.
Modern era (post-1965)
After the 1965 Hart-Cellar Act, Ranson saw modest immigration, but the real demographic shift began in the 1990s and 2000s. Hispanic families, primarily from Mexico and Central America, moved into the South Ranson area—a corridor of older homes and rental units near the Charles Town border—drawn by construction and service jobs in the growing Washington, D.C., exurbs. The Hispanic share rose from under 5% in 2000 to 13.9% today. Meanwhile, East/Southeast Asian communities (Vietnamese, Filipino, and Korean families) settled in the West End, a quieter pocket of 1960s-era ranches and split-levels, often working in nearby retail, healthcare, or family-run restaurants. The Black population, historically small, has remained stable at 6.0%, concentrated in the Ranson Heights public housing complex and adjacent blocks. Domestic in-migration from the Baltimore-Washington metro area has accelerated since 2010, with White families—many seeking cheaper housing—buying into Ranson Crossing, a newer subdivision of vinyl-sided colonials. This influx has kept the city’s population flat (5,588 in 2024, up from 5,200 in 2010) despite an aging native-born cohort.
The future
Ranson’s population is heading toward greater diversity but also economic stratification. The Hispanic community is growing fastest, driven by both births and continued immigration, and is likely to reach 18-20% of the population by 2035. East/Southeast Asian families are plateauing, with many second-generation adults moving to larger metro areas for jobs. The White population, while still the majority, is aging—the median age for White residents is 42, compared to 29 for Hispanics—and younger White families are increasingly choosing newer subdivisions in nearby Charles Town or Shepherdstown. The city is not tribalizing into hostile enclaves, but distinct neighborhoods are solidifying: South Ranson is becoming a Hispanic-majority corridor, West End remains a stable Asian-White mix, and Old Town is gentrifying as commuters renovate historic rowhouses. The biggest wildcard is housing affordability: if Ranson builds more single-family homes, it will attract more White families; if it adds apartments, it will absorb more immigrants. The college-educated share (15.7%) is unlikely to rise sharply without a major employer or university anchor.
For someone moving in now, Ranson is a working-class city in transition—more diverse than its Jefferson County neighbors, but still majority-White and family-oriented. The schools are improving, crime is low, and the cost of living is 20% below the national average. The city is becoming a Hispanic-influenced, blue-collar suburb of the D.C. exurbs, not a homogenized bedroom community. New arrivals should expect a place where old railroad families, immigrant entrepreneurs, and commuter newcomers coexist in distinct but generally peaceful neighborhoods.
* Values derived from national, state, county, city and local statistics and may differ in a specific area. Last updated: 2026-04-23T06:07:43.000Z
Narrative content on this page is AI-generated and may contain mistakes. Verify any details that matter before acting on them.
ReloMaps may earn a commission from affiliate links at no extra cost to you.