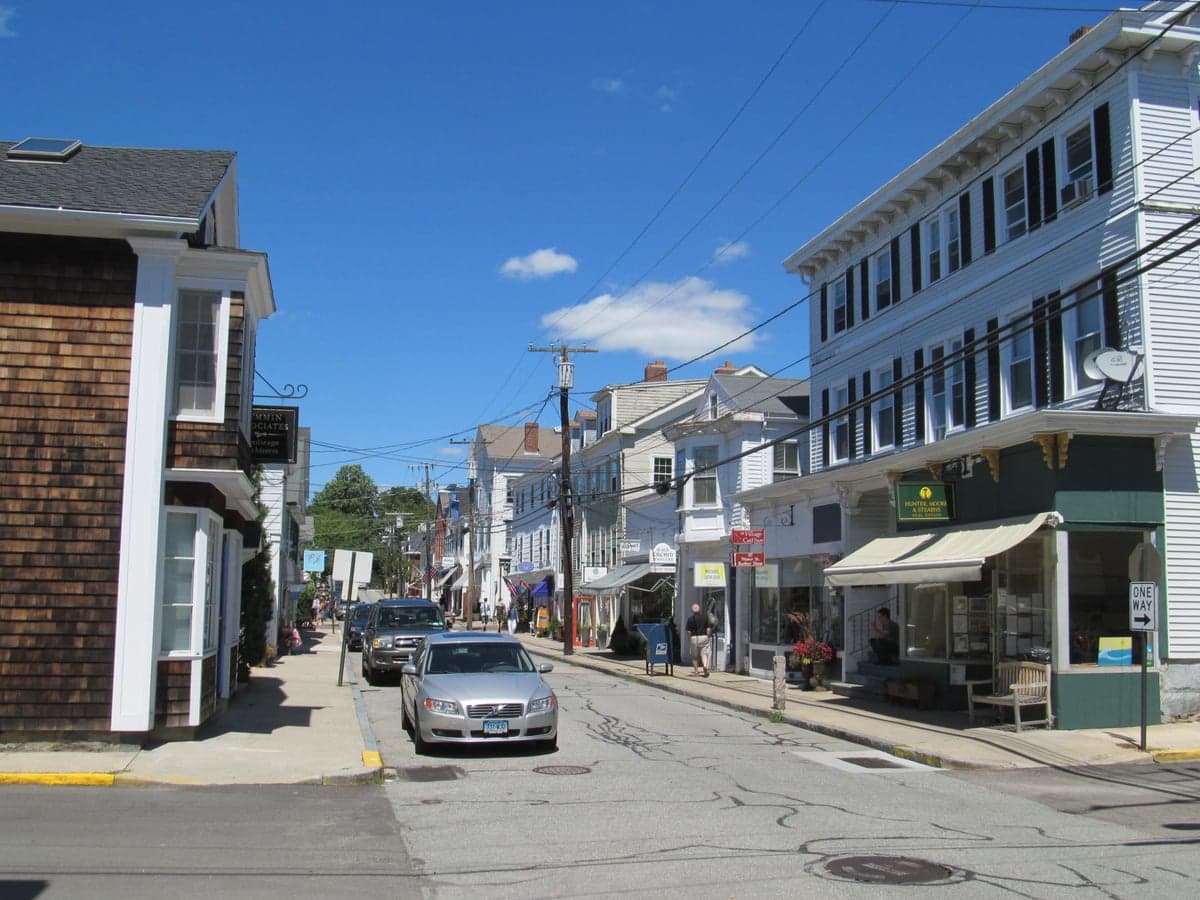

Photo: Wikipedia
Demographics of Stonington, CT
Affluence Level in Stonington, CT
A wealthy area with high-earning, well-educated households. Incomes, home values, and educational attainment meaningfully outpace national averages.
People of Stonington, CT
The people of Stonington, Connecticut, today form a small, highly educated, and predominantly white community of 934 residents, with a distinctive character shaped by deep Yankee roots and a quiet coastal identity. The village is notably homogeneous, with 87.3% of the population identifying as white, a Hispanic share of 8.4%, and minimal representation from other groups—0.0% Black, 1.0% East/Southeast Asian, and 0.3% Indian (subcontinent). With 71.9% of adults holding a college degree and a foreign-born population of just 2.1%, Stonington stands as one of the most demographically stable and academically credentialed enclaves in southeastern Connecticut, a place where historic preservation and generational continuity define daily life.
How the city was settled and grew
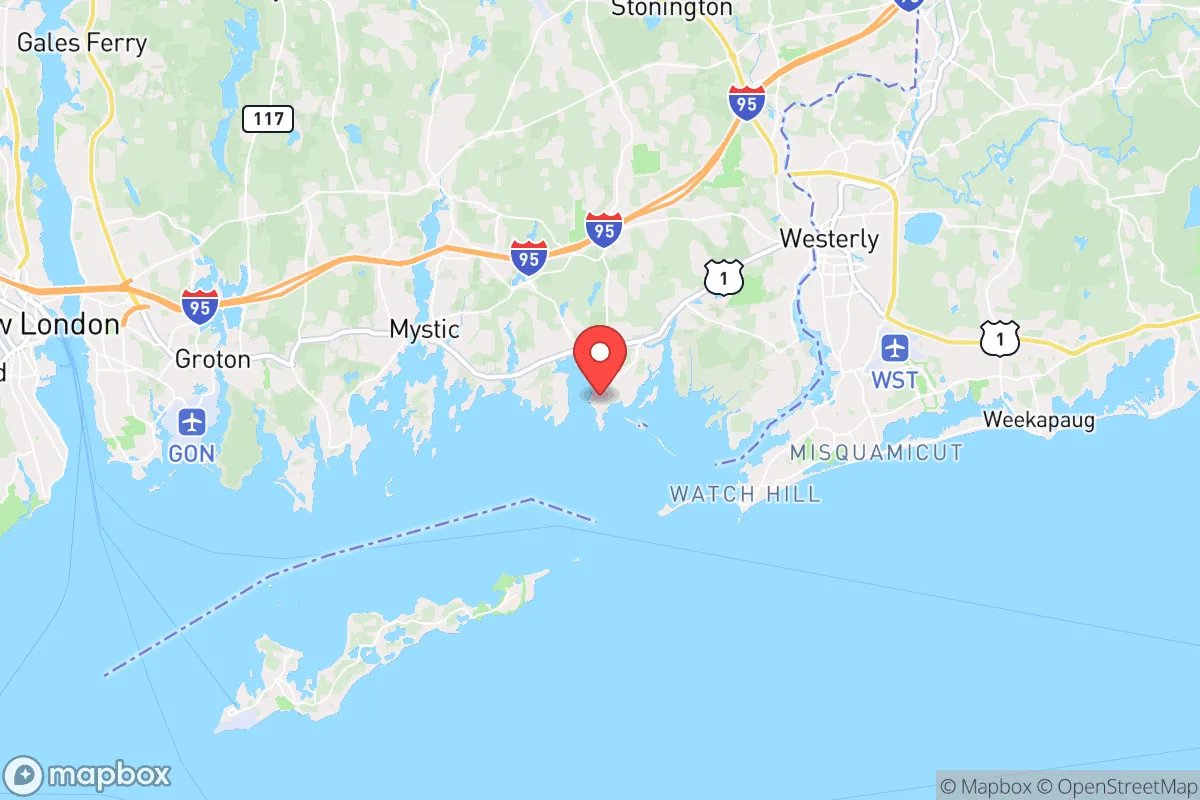
Stonington’s human history begins with its founding in 1649 by English colonists from the Massachusetts Bay Colony and Plymouth, who were drawn by the deep, sheltered harbor and abundant coastal land for farming and fishing. The original settlement clustered around what is now the Stonington Borough—a narrow peninsula jutting into Fishers Island Sound—where families like the Denisons, Chesebroughs, and Stantons established a maritime economy. By the 18th century, the village became a major whaling and sealing port, attracting a mix of English-descended ship captains, merchants, and skilled craftsmen who built the Federal-style homes that still line Water and Main Streets. A second wave arrived in the mid-19th century with Irish immigrants fleeing the Great Famine, who settled in the Mystic River area (now part of the Mystic village, which straddles Stonington and Groton) and worked in the growing shipbuilding and granite quarrying industries. Italian immigrants followed in the early 1900s, establishing a small enclave in the Pawcatuck neighborhood along the Rhode Island border, where they found work in textile mills and the local granite quarries. These waves were modest in scale—Stonington never experienced the mass immigration of larger industrial cities—and the village’s population remained overwhelmingly white and Yankee through the mid-20th century, with the 1950 census recording a population of roughly 1,200 and a foreign-born share under 5%.
Modern era (post-1965)
After the 1965 Hart-Cellar Act, Stonington saw virtually no new immigration from Asia, Latin America, or Africa, a pattern that persists today. The village’s foreign-born population of 2.1% is among the lowest in Connecticut, and the 8.4% Hispanic share is almost entirely domestic in-migration from other parts of the state, concentrated in the Pawcatuck neighborhood, where a small number of Puerto Rican and Mexican-origin families have settled since the 1990s. The East/Southeast Asian population of 1.0% and Indian (subcontinent) population of 0.3% are negligible, reflecting the village’s lack of the tech or academic employment anchors that draw these groups to other New England towns. Domestic in-migration has been the dominant demographic force: since the 1970s, Stonington has attracted affluent professionals from New York City, Boston, and Hartford, drawn by its historic charm, waterfront setting, and proximity to the Mystic Seaport and the Rhode Island coast. These newcomers have largely settled in the Stonington Borough and the Mystic River area, where they have renovated 18th- and 19th-century homes and driven up property values. The result is a community that has become more economically stratified—longtime Yankee families in the Borough coexist with wealthy second-home owners and retirees—but remains racially static, with the white share holding steady above 85% since 2000.
The future
Stonington’s population is heading toward further homogenization and aging, with no major demographic shifts on the horizon. The village’s high housing costs—median home values exceed $600,000—and limited rental stock effectively filter out younger, less affluent families, while the absence of large employers or universities means few job-driven migrants. The Hispanic share may grow slowly as Pawcatuck’s small Latino community expands through natural increase, but it is unlikely to exceed 12-15% by 2040. The East/Southeast Asian and Indian populations will likely remain below 2% each, as Stonington lacks the ethnic infrastructure—temples, grocery stores, community organizations—that sustains larger Asian enclaves in nearby towns like Groton or New London. The village is not tribalizing into distinct enclaves; rather, it is consolidating as a single, wealthy, white-majority historic district, with the Borough and Mystic River areas absorbing most new residents and Pawcatuck remaining a modest, more diverse working-class pocket. For someone moving in now, Stonington offers a stable, preservation-minded community with little demographic churn, but also limited diversity and a high barrier to entry for anyone not already affluent.
Stonington is becoming a curated historic village for the wealthy and the retired—a place where the population is shrinking slightly (down from 1,045 in 2010) but growing in affluence and educational attainment. For a conservative-leaning individual or parent seeking a safe, scenic, and culturally homogeneous environment with strong schools and low crime, Stonington delivers exactly that. The trade-off is a lack of demographic dynamism and a social fabric that can feel insular, with few opportunities for newcomers who do not already fit the village’s established profile.
* Values derived from national, state, county, city and local statistics and may differ in a specific area. Last updated: 2026-04-19T08:24:39.000Z
Narrative content on this page is AI-generated and may contain mistakes. Verify any details that matter before acting on them.
ReloMaps may earn a commission from affiliate links at no extra cost to you.