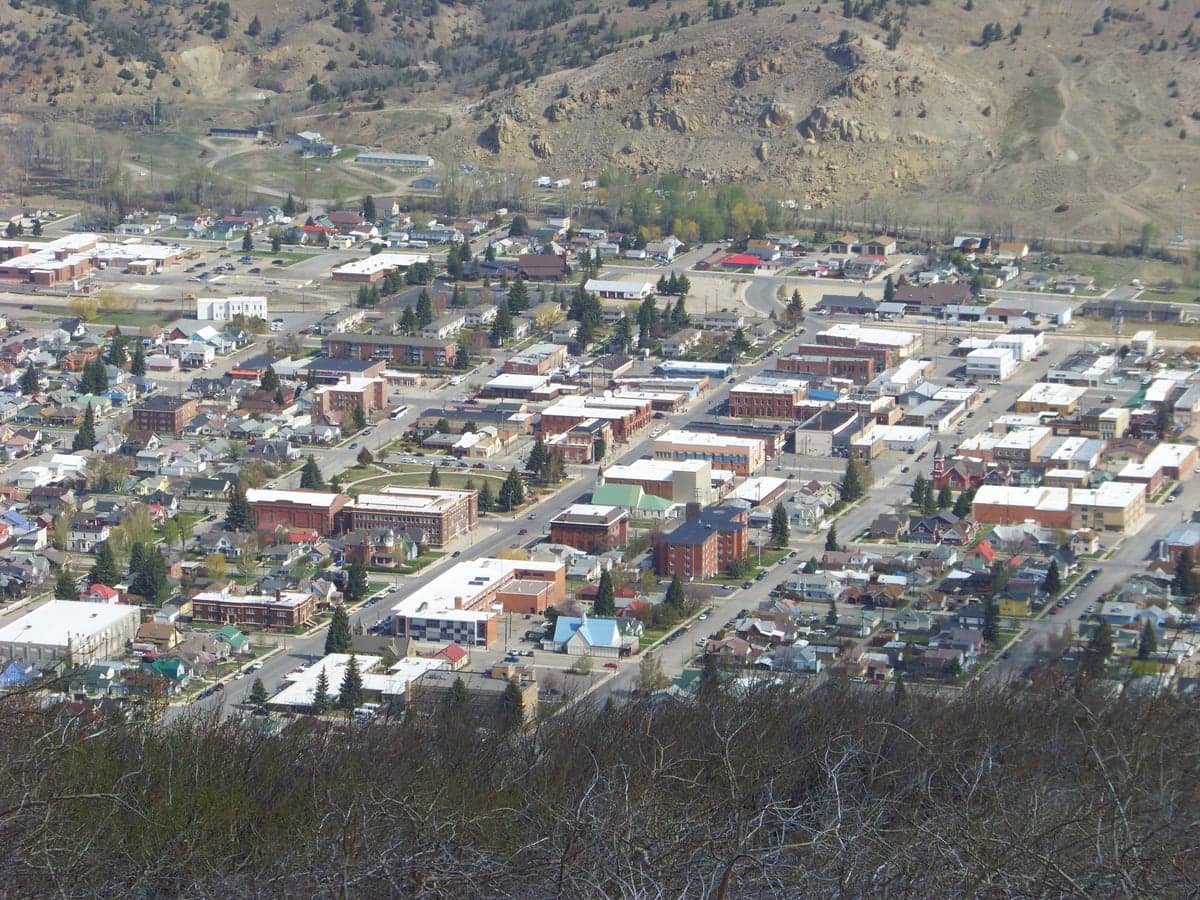
Photo: Wikipedia
Demographics of Anaconda, MT
Affluence Level in Anaconda, MT
A middle-class area roughly in line with national averages across income, home values, education, and employment.
People of Anaconda, MT
The people of Anaconda, Montana, today number 9,512, forming a predominantly white, working-class community with a distinctive Irish-Catholic heritage rooted in the city's founding as a company town for the Anaconda Copper Mining Company. The population is notably homogeneous: 89.9% white, 3.4% Hispanic, 0.7% East/Southeast Asian, 0.3% Black, and 0.2% foreign-born, with a college attainment rate of 22.3%. This is a place where family names like "Walsh" and "O'Leary" still carry weight, and where the physical layout—from the historic downtown to the hillside neighborhoods—reflects the rigid class and ethnic divisions of the smelter era.
How the city was settled and grew
Anaconda was founded in 1883 as a planned company town by Marcus Daly, one of the Copper Kings, who built the Washoe Smelter to process ore from the Butte mines. The original population was overwhelmingly Irish and Irish-American, recruited directly from the mines of Butte and from Ireland itself to work the smelters. These workers settled in the Smelter City neighborhood, the flat ground immediately east of the smelter complex, where company-built row houses and boarding houses lined streets like Commercial Avenue and Park Avenue. The Irish dominated the workforce and the city's politics for generations, establishing St. Mark's Catholic Church (1887) as the spiritual and social anchor. A secondary wave of Croatian, Serbian, and Slovenian immigrants arrived between 1900 and 1910, drawn by the same smelter jobs. They clustered in the East Side neighborhood, around East Third and East Fourth Streets, where they built the Holy Family Croatian Catholic Church (190桔) and maintained distinct fraternal lodges. The smelter's peak employment of roughly 4,000 workers in the 1910s made Anaconda a boomtown, but the population was always overwhelmingly white and European-born, with virtually no Black or Asian settlement until the late 20th century. The city's growth plateaued after the smelter's closure in 1980, and the population has declined steadily from a peak of 12,000 in 1960.
Modern era (post-1965)
After the Hart-Cellar Act of 1965, Anaconda saw almost no new immigration. The foreign-born share today is 0.2%, among the lowest in Montana. The city's demographic story since the 1970s is one of domestic out-migration and aging. The West Side neighborhood, originally built for smelter managers and professionals, saw an influx of retirees and second-home buyers from California and the Pacific Northwest starting in the 1990s, drawn by low property prices and the nearby Pintler Wilderness. This group is whiter and older than the general population, and they have renovated many of the historic Queen Anne and Craftsman homes along Main Street and West Park Avenue. The South Side neighborhood, a post-war subdivision of ranch-style homes built in the 1950s and 1960s, remains the most stable family area, with a mix of multi-generational Anacondans and younger families priced out of Bozeman and Missoula. The Hispanic population, at 3.4%, is small but growing, concentrated in the Smelter City area, where a handful of Mexican-American families have opened taquerias and grocery stores along Commercial Avenue. The East/Southeast Asian population (0.7%) is almost entirely Hmong and Vietnamese refugees who resettled in the 1980s and 1990s, with a small cluster near the Anaconda High School area on Main Street. The Black population (0.3%) is negligible, consisting of a few military families stationed at the nearby Malmstrom Air Force Base in Great Falls.
The future
Anaconda's population is projected to continue a slow decline, dropping to roughly 8,500 by 2040, as the remaining smelter-era generation passes away and young adults leave for college and jobs in Missoula, Bozeman, and Billings. The city is not homogenizing so much as aging in place, with the median age rising from 42 in 2010 to an estimated 48 in 2025. The Hispanic share may grow to 5-6% by 2040, driven by natural increase and a trickle of service-sector workers from the broader Montana Hispanic community, but the foreign-born share will likely remain below 1%. The West Side will continue to attract out-of-state retirees, while the East Side and Smelter City neighborhoods will see the most turnover as older homeowners sell to younger families seeking affordable housing. There is no sign of tribalization into distinct ethnic enclaves; the small non-white populations are dispersed and assimilating into the broader white community. The biggest demographic wildcard is climate migration: if drought and wildfire pressure in California and the Southwest accelerates, Anaconda could see a modest influx of remote workers and retirees, but the city lacks the job base and amenities to attract large numbers.
For someone moving in now, Anaconda offers a stable, safe, and affordable community with a strong sense of place, but it is a place where the population is shrinking, aging, and becoming slightly more diverse only at the margins. The dominant culture remains Irish-Catholic, working-class, and politically moderate-to-conservative, and newcomers—especially those from outside Montana—will find a community that is welcoming but slow to change. The bottom line: Anaconda is a town that has already seen its peak, and its future is one of gradual contraction, not growth.
* Values derived from national, state, county, city and local statistics and may differ in a specific area. Last updated: 2026-04-30T03:41:35.000Z
Narrative content on this page is AI-generated and may contain mistakes. Verify any details that matter before acting on them.
ReloMaps may earn a commission from affiliate links at no extra cost to you.