Photo: Wikipedia
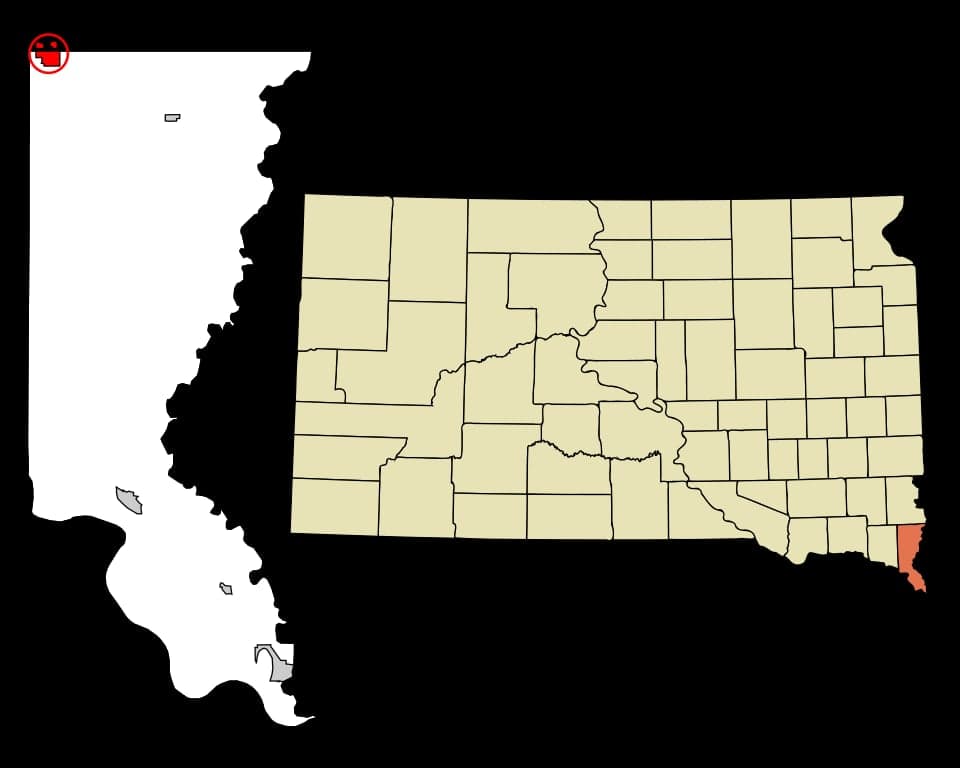
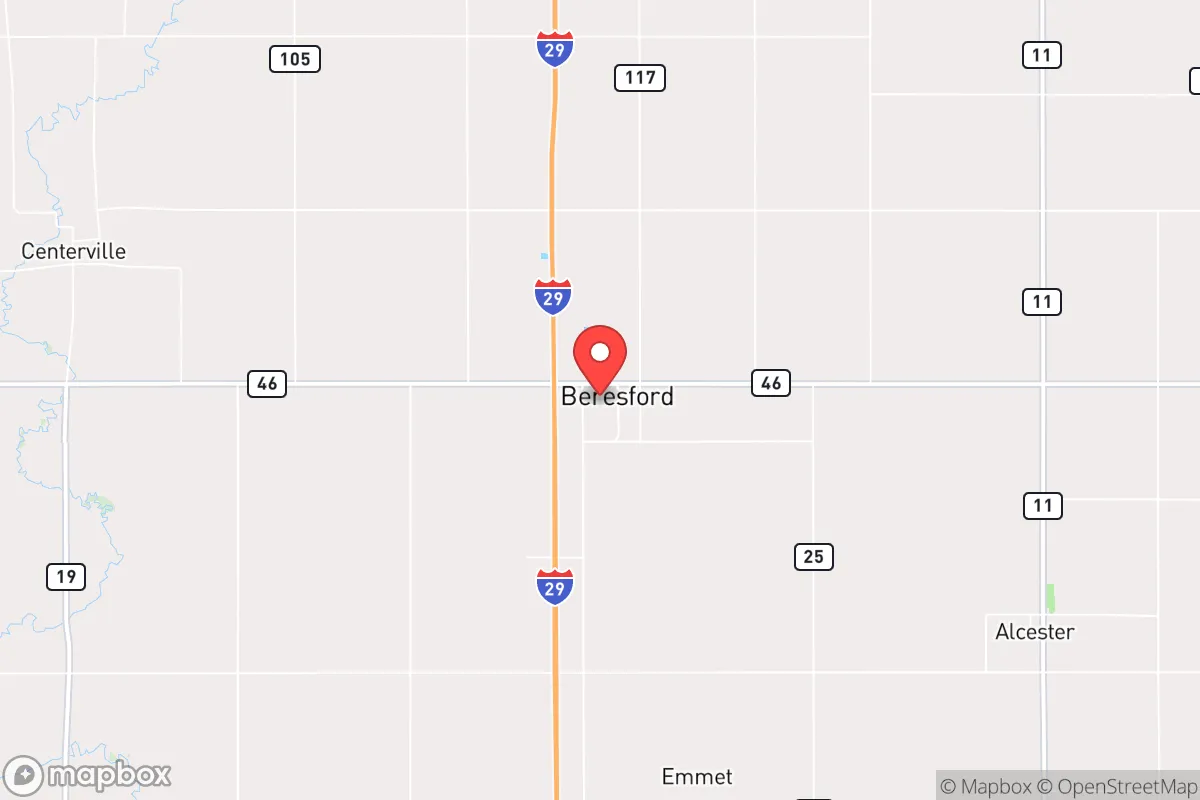
Demographics of Beresford, SD
Affluence Level in Beresford, SD
A middle-class area roughly in line with national averages across income, home values, education, and employment.
People of Beresford, SD
The people of Beresford, South Dakota today form a predominantly white, family-oriented community of 2,437 residents, with a notably low foreign-born share of 3.6% and a modest Hispanic presence of 5.9%. The city’s character is shaped by its agricultural roots and its role as a small regional service hub in Union and Lincoln counties, with a college-educated rate of 25.9% reflecting a workforce grounded in trades, healthcare, and local business rather than a large professional class. Distinctive identity markers include a strong sense of civic pride centered on the Beresford School District and the annual Beresford Summerfest, which reinforce a close-knit, conservative-leaning social fabric. The population is overwhelmingly white (88.6%), with negligible Black (0.4%) and East/Southeast Asian (0.0%) communities, and a small Indian-subcontinent share of 0.6%.
How the city was settled and grew
Beresford was founded in 1884 as a railroad town on the Chicago, Milwaukee, St. Paul and Pacific line, which drew the first wave of settlers—primarily Scandinavian and German immigrants seeking homesteads on the fertile prairie. The original plat, laid out along the rail corridor, created the Downtown Beresford district, where early merchants, blacksmiths, and grain elevator operators clustered. A second wave arrived in the 1890s and early 1900s, composed of Norwegian and Danish farmers who established the North Beresford neighborhood, characterized by modest frame houses on larger lots that still reflect the area’s agricultural orientation. By 1910, the population had reached roughly 800, supported by the Beresford Creamery and the Beresford Brick & Tile Company, which employed many of the town’s early working-class families. The South Side district, developed after World War I, housed railroad workers and their families in smaller bungalows, while the East End—closer to the rail yards—became a mixed-income area where second-generation Scandinavian and German families settled. No significant non-European immigration occurred during this period; the population remained nearly entirely white through the mid-20th century.
Modern era (post-1965)
After the 1965 Hart-Cellar Act, Beresford saw virtually no new immigration from Asia, Africa, or Latin America, consistent with its remote location and lack of industrial employers that might attract foreign-born workers. The city’s foreign-born share of 3.6% in 2020 is almost entirely attributable to a small number of European-origin residents and a handful of Indian-subcontinent professionals employed at the Beresford Medical Clinic or the local Sanford Health satellite facility. Domestic in-migration since the 1970s has been dominated by white families from nearby Sioux Falls (about 25 miles north) and rural Lincoln and Union counties, drawn by lower housing costs and the reputation of the Beresford School District. The West Beresford subdivision, developed in the 1990s and 2000s, absorbed most of these newcomers, featuring newer single-family homes on cul-de-sacs that contrast with the older grid-pattern neighborhoods. The Hispanic population, now 5.9%, grew slowly after 2000, primarily through Mexican-origin families working in agriculture and meatpacking at plants in nearby Dakota Dunes and Sioux City; they have concentrated in rental housing along the Railroad Avenue corridor and in the South Side district. The Indian-subcontinent share (0.6%) is limited to a handful of physicians and IT workers, with no distinct ethnic enclave. The Black and East/Southeast Asian populations remain negligible, reflecting the city’s lack of diversity-attracting industries or refugee resettlement programs.
The future
Beresford’s population is projected to grow slowly, likely reaching 2,600–2,800 by 2040, driven by spillover from Sioux Falls’ expansion and the city’s appeal as a low-crime, low-tax alternative. The white share will remain dominant, though the Hispanic population may rise to 8–10% as agricultural and service-sector jobs continue to attract Mexican-origin families, who are gradually assimilating into the broader community rather than forming isolated enclaves. The Indian-subcontinent and East/Southeast Asian shares are unlikely to grow significantly without a major employer shift, as the local economy lacks the tech or academic sectors that drive such migration. The city is homogenizing in the sense that new housing developments in West Beresford and the planned Prairie View Addition are attracting almost exclusively white families, while the Hispanic population remains concentrated in older rental stock. No tribalization into distinct ethnic neighborhoods is occurring; instead, the pattern is one of gradual, modest diversification within a still-overwhelmingly white framework.
For a mover considering Beresford, the city offers a stable, predominantly white, family-oriented community with low crime, good schools, and a conservative political culture. The population is not diversifying rapidly, and the small Hispanic and Indian-subcontinent communities are integrated rather than segregated. The next decade will likely see continued slow growth, with the city remaining a quiet, affordable satellite of Sioux Falls rather than becoming a multicultural hub. This is a place for those seeking predictability and traditional small-town life, not demographic change or urban amenities.
* Values derived from national, state, county, city and local statistics and may differ in a specific area. Last updated: 2026-05-02T05:33:49.000Z
Narrative content on this page is AI-generated and may contain mistakes. Verify any details that matter before acting on them.
ReloMaps may earn a commission from affiliate links at no extra cost to you.