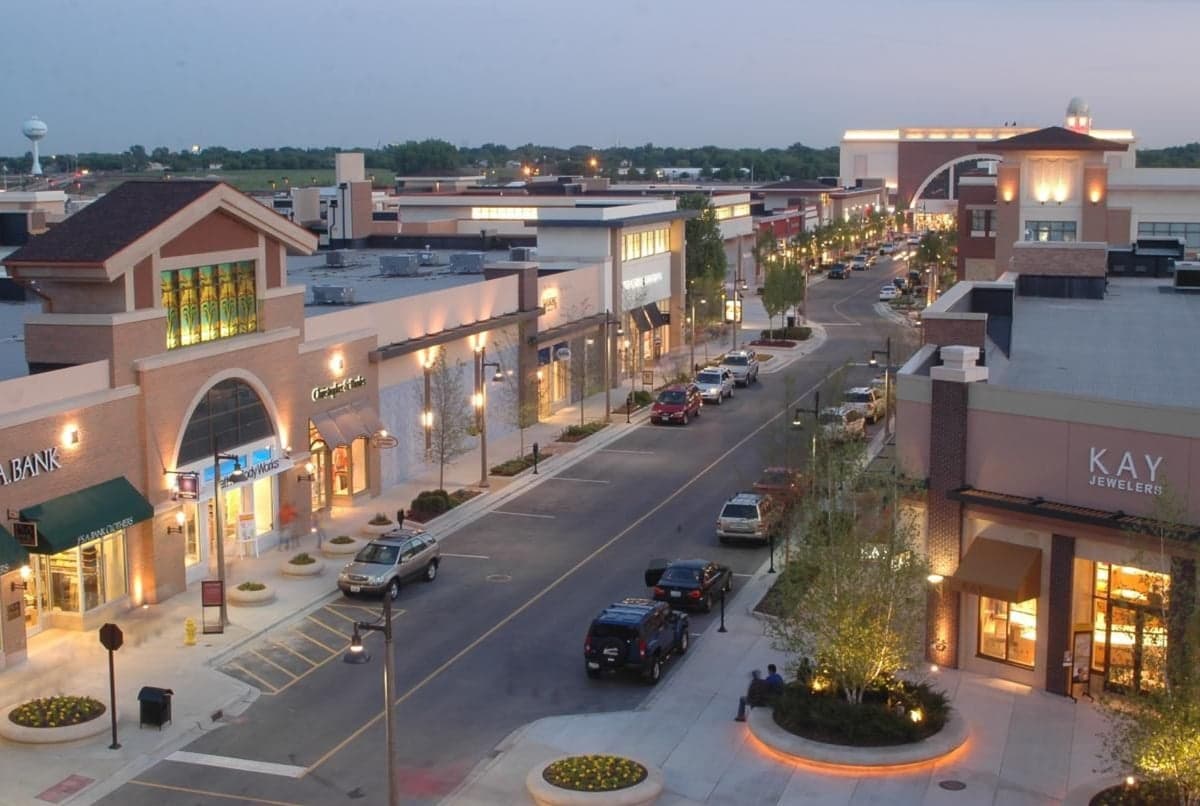
Photo: Wikipedia
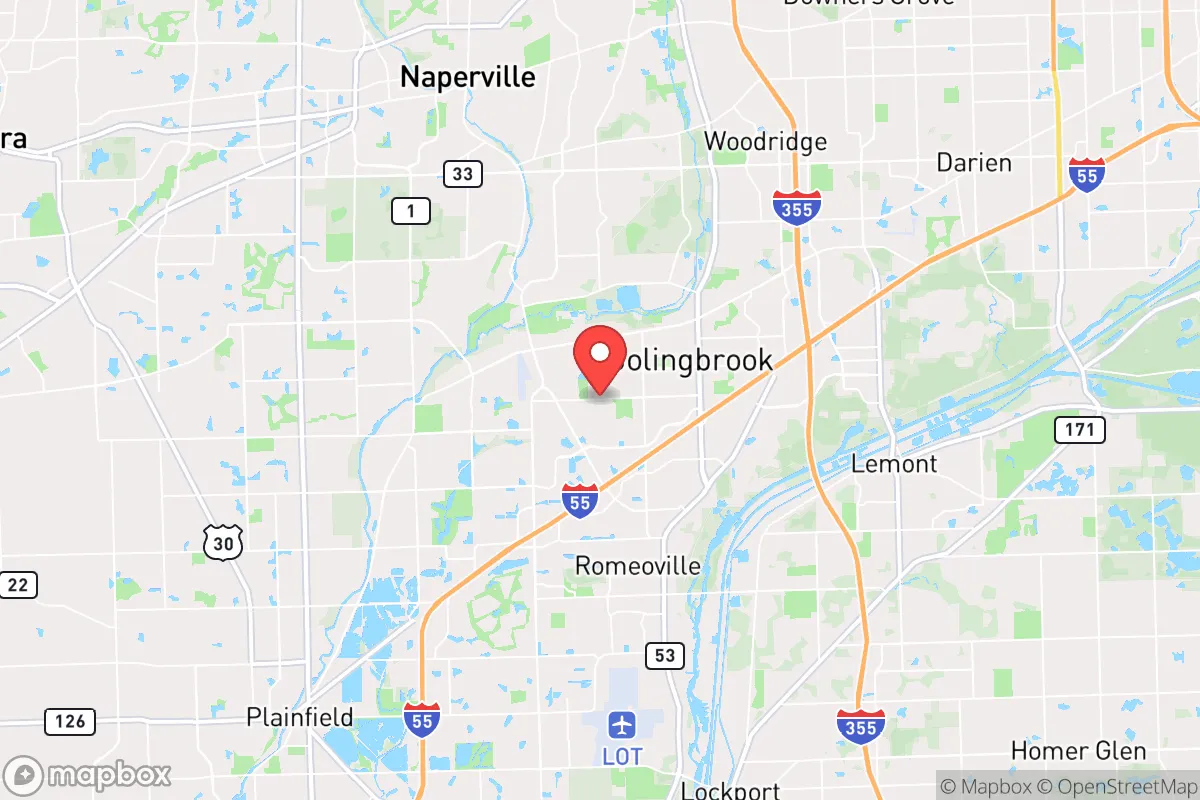
Demographics of Bolingbrook, IL
Affluence Level in Bolingbrook, IL
A middle-class area roughly in line with national averages across income, home values, education, and employment.
People of Bolingbrook, IL
Bolingbrook, Illinois, is a diverse, family-oriented suburb of 73,813 residents where no single ethnic group holds a majority, creating a distinctive mosaic of communities. The city is characterized by its blend of established single-family home neighborhoods and newer developments, with a population that is 36.3% White, 28.2% Hispanic, 18.2% Black, 7.4% Indian (subcontinent), and 6.5% East/Southeast Asian. A relatively high 38.5% of adults hold a college degree, reflecting a population that is both working- and middle-class, with a strong pull toward professional and technical employment in the greater Chicago area. The city’s identity is one of pragmatic diversity, where different ethnic groups have settled into distinct neighborhoods while sharing common civic spaces and schools.
How the city was settled and grew
Bolingbrook is a post-World War II suburb, not a historic settlement. The area was originally farmland, part of DuPage and Will counties, with no significant population until the 1960s. The city’s founding is tied to the development of the Bolingbrook subdivision, a master-planned community launched in the early 1960s by the Bolingbrook Development Company. The first wave of residents were largely white, middle-class families moving from Chicago and nearby suburbs, drawn by affordable new homes on large lots. The original core neighborhoods—Bolingbrook Estates and Westbrook—were built during this period, featuring ranch and split-level homes that attracted young families seeking space and good schools. The village incorporated in 1965, and growth accelerated through the 1970s as the interstate highway system (I-55) made commuting to Chicago and Joliet feasible. By 1980, the population had surged past 20,000, still overwhelmingly white and native-born.
Modern era (post-1965)
Bolingbrook’s demographic transformation began in earnest after 1990, driven by two forces: the continued suburbanization of Chicago’s minority populations and new immigration under the 1965 Hart-Cellar Act’s family reunification provisions. The Hispanic population grew rapidly from the 1990s onward, settling primarily in the Lily Cache and Indian Chase neighborhoods, where older, more affordable housing stock provided entry points for working-class families. The Black population, which was negligible in 1980, expanded significantly after 2000, with many families moving from Chicago’s South Side and southern suburbs into the Woodcreek and Clover Ridge subdivisions, drawn by newer construction and lower crime rates compared to nearby areas. The Indian (subcontinent) community, now 7.4% of the population, began arriving in the 2000s, clustering in the Ashbury and Winston Hills neighborhoods, attracted by the highly rated Valley View School District and proximity to tech and healthcare jobs in Naperville and Lisle. East/Southeast Asian residents (6.5%) followed a similar pattern, with many settling in the same newer subdivisions. The foreign-born share now stands at 10.1%, a figure that has stabilized over the past decade as immigration has plateaued.
The future
Bolingbrook’s population is likely to continue diversifying, but at a slower pace than in the 1990s and 2000s. The White share has dropped from over 80% in 1990 to 36.3% today, and this decline is expected to moderate as the city reaches a more stable multiethnic equilibrium. The Hispanic and Black populations are projected to grow modestly, driven by natural increase and continued domestic migration from Chicago, while the Indian and East/Southeast Asian communities are likely to plateau or grow slowly, as the area becomes less affordable for new immigrants compared to farther-out suburbs. The city is not tribalizing into isolated enclaves; rather, neighborhoods like Ashbury and Woodcreek are becoming more mixed over time, with second-generation families moving into previously homogeneous areas. The biggest demographic shift ahead may be aging: the median age is rising as the original 1960s-70s families age in place, while younger families are drawn to newer developments on the city’s western edge.
For a conservative-leaning individual or family considering a move, Bolingbrook offers a stable, increasingly diverse community with solid schools and a strong tax base. The city is becoming a place where different ethnic groups coexist without major friction, though distinct neighborhood identities persist. The practical implication is that a newcomer can choose a neighborhood that matches their preferences—whether a newer, more diverse subdivision or an older, more established area—while still benefiting from shared civic amenities and a relatively low crime rate for a suburb of its size. Bolingbrook is not a homogenizing melting pot, but a functional mosaic where diversity is a fact of daily life rather than a political statement.
* Values derived from national, state, county, city and local statistics and may differ in a specific area. Last updated: 2026-04-30T01:32:34.000Z
Narrative content on this page is AI-generated and may contain mistakes. Verify any details that matter before acting on them.
ReloMaps may earn a commission from affiliate links at no extra cost to you.