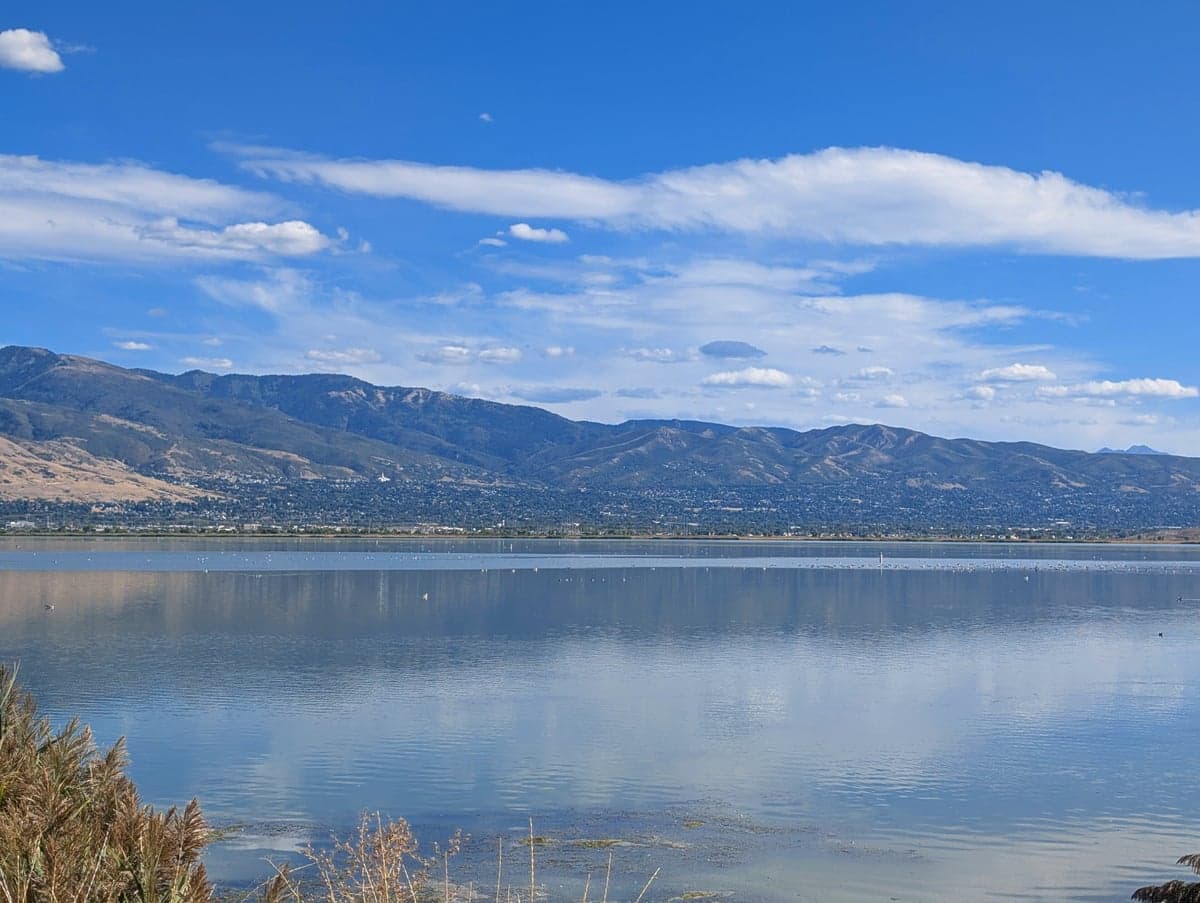
Photo: Wikipedia
Demographics of Bountiful, UT
Affluence Level in Bountiful, UT
An upper-middle-class area. Household wealth, education levels, and homeownership run ahead of national benchmarks.
People of Bountiful, UT
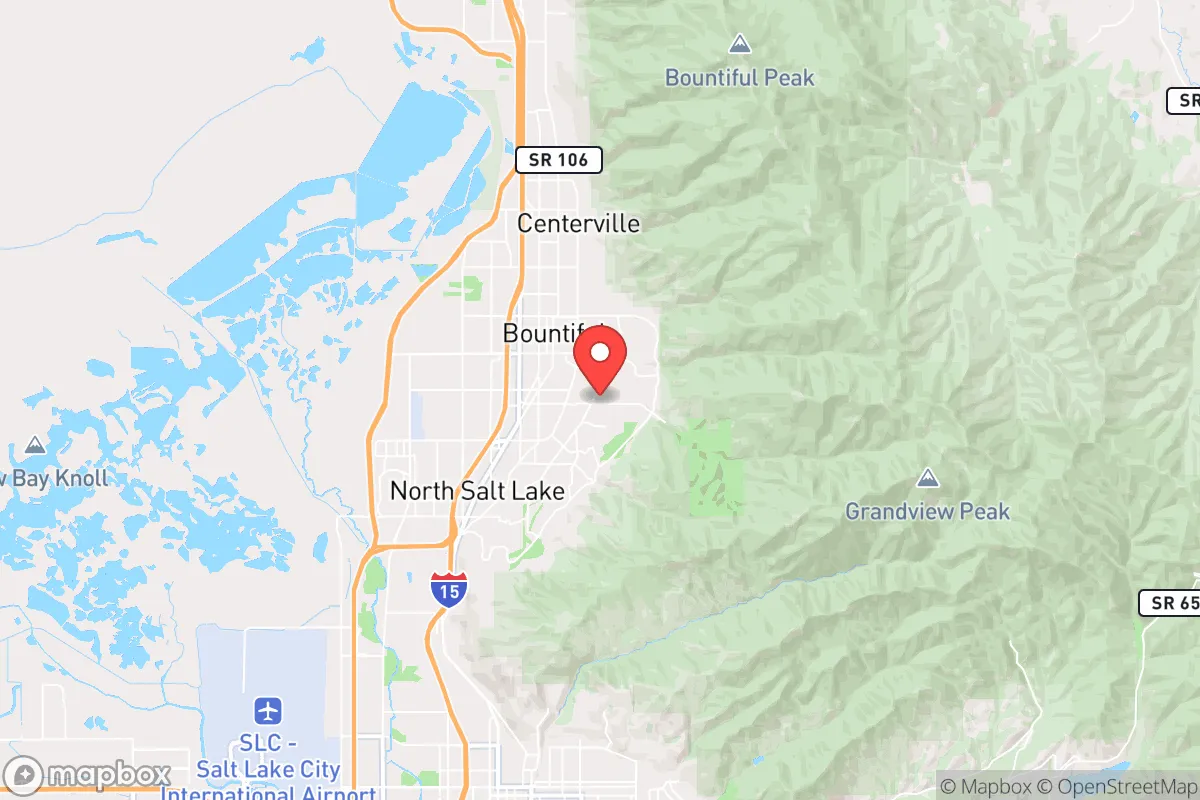
Bountiful, Utah, is a predominantly white, highly educated, and family-oriented suburb of Salt Lake City, with a population of 45,093 that is 83.0% white and 46.6% college-educated. The city is characterized by its strong Latter-day Saint (LDS) cultural heritage, low crime rates, and a deeply rooted sense of community that traces back to its original Mormon settlers. With a foreign-born population of just 2.3%, Bountiful remains one of the least ethnically diverse cities in the Wasatch Front, though its Hispanic community (8.2%) is the largest minority group. The city’s identity is shaped by its historic pioneer origins, its role as a bedroom community for Salt Lake City, and its reputation as a stable, family-centric enclave where generational continuity is the norm.
How the city was settled and grew
Bountiful was founded in 1847 by Mormon pioneers led by Perrigrine Sessions, just months after Brigham Young’s first party entered the Salt Lake Valley. The original settlers were predominantly converts from the British Isles and Scandinavia, drawn by the religious mission of the LDS Church and the promise of irrigated farmland in the fertile foothills of the Wasatch Range. The first wave built homes and farms in what is now the Historic Downtown Bountiful area, centered around Main Street and 200 South, where many original pioneer homes still stand. By the 1850s, the settlement expanded into the Bountiful Bench neighborhood, a series of terraced lots on the eastern slopes that offered prime agricultural land and views of the Great Salt Lake. The completion of the transcontinental railroad in 1869 and the arrival of the Utah Central Railroad in the 1870s brought a second wave of settlers, including merchants and tradesmen, who established the West Bountiful district near the rail lines. Through the early 20th century, Bountiful remained a small, agrarian community of fewer than 5,000 residents, with its population growth tied almost entirely to natural increase and continued LDS migration from rural Utah.
Modern era (post-1965)
The post-1965 era transformed Bountiful from a farming town into a suburban bedroom community. The 1960s and 1970s saw a surge of domestic in-migration from other parts of Utah and the Intermountain West, driven by the expansion of Salt Lake City’s economy and the construction of Interstate 15, which made Bountiful a convenient commute. New subdivisions such as Val Verde and Orchard Hills were developed on the city’s northern and eastern edges, attracting young LDS families seeking larger lots and newer homes. The city’s white population remained dominant, with the 1980 census showing a 98% white share. The Hispanic population began to grow slowly from the 1990s onward, settling primarily in the South Bountiful area near 500 South, where older, more affordable housing stock provided entry points. The East/Southeast Asian community (0.7%) and Indian subcontinent community (0.3%) remain very small, with no distinct ethnic enclaves; these residents are dispersed across the city, often in the newer subdivisions of Stonebridge and Eaglewood. The Black population (1.3%) is similarly scattered, with no concentrated neighborhood. Overall, Bountiful’s modern demographic story is one of stability rather than transformation: the city has absorbed modest diversity without altering its core white, LDS character.
The future
Bountiful’s population is projected to remain stable or grow slowly, with the city nearing build-out capacity. The Hispanic share is likely to increase gradually, potentially reaching 10-12% by 2040, driven by natural increase and in-migration from other parts of Davis County. However, the city’s high home prices (median home value above $500,000) and limited rental stock will continue to constrain in-migration from lower-income groups, including recent immigrants. The East/Southeast Asian and Indian communities are expected to remain small, as Bountiful lacks the job centers or ethnic infrastructure (e.g., temples, grocery stores, cultural organizations) that attract larger populations. The white population will likely decline slightly as older residents age out and younger families move to more affordable suburbs farther north, such as Farmington or Kaysville. Bountiful is not homogenizing or tribalizing into distinct enclaves; rather, it is becoming a slightly more diverse but still overwhelmingly white and LDS community, where new residents—especially those from outside Utah—may find a welcoming but culturally insular environment.
For a conservative-leaning individual or family considering relocation, Bountiful offers a safe, well-educated, and community-oriented environment with strong schools and low crime. The city’s demographic trajectory suggests it will remain a predominantly white, LDS suburb with modest Hispanic growth, making it an ideal fit for those seeking stability and traditional values. However, newcomers should be prepared for a culture deeply shaped by the LDS Church, where social networks often revolve around ward boundaries and church activities. If you value a tight-knit, low-diversity community with excellent public services and a strong sense of place, Bountiful is a compelling choice—but it is not a place of rapid demographic change or cosmopolitan diversity.
* Values derived from national, state, county, city and local statistics and may differ in a specific area. Last updated: 2026-04-21T12:16:27.000Z
Narrative content on this page is AI-generated and may contain mistakes. Verify any details that matter before acting on them.
ReloMaps may earn a commission from affiliate links at no extra cost to you.