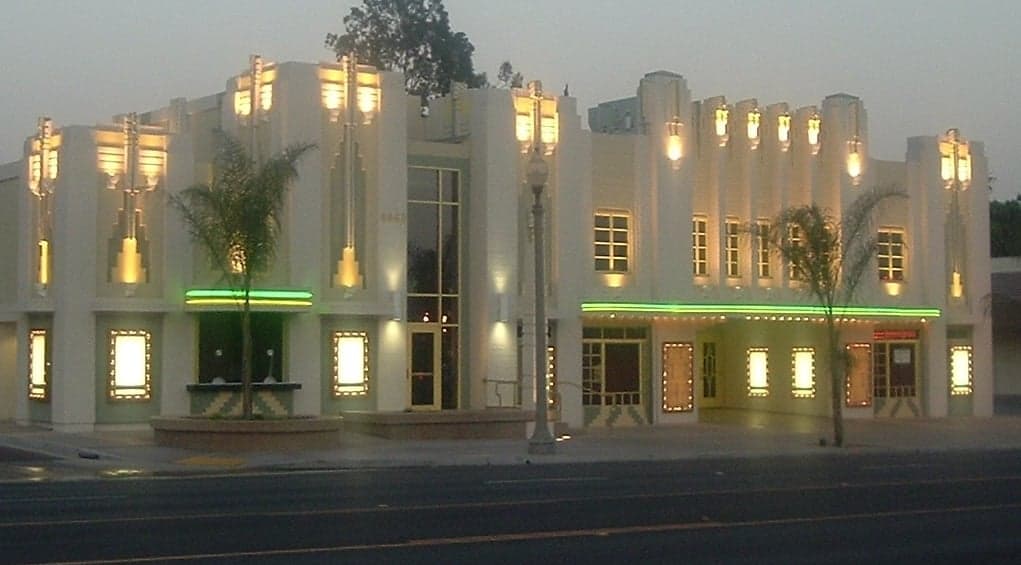
Photo: Wikipedia
Quality of Life in Fontana, CA
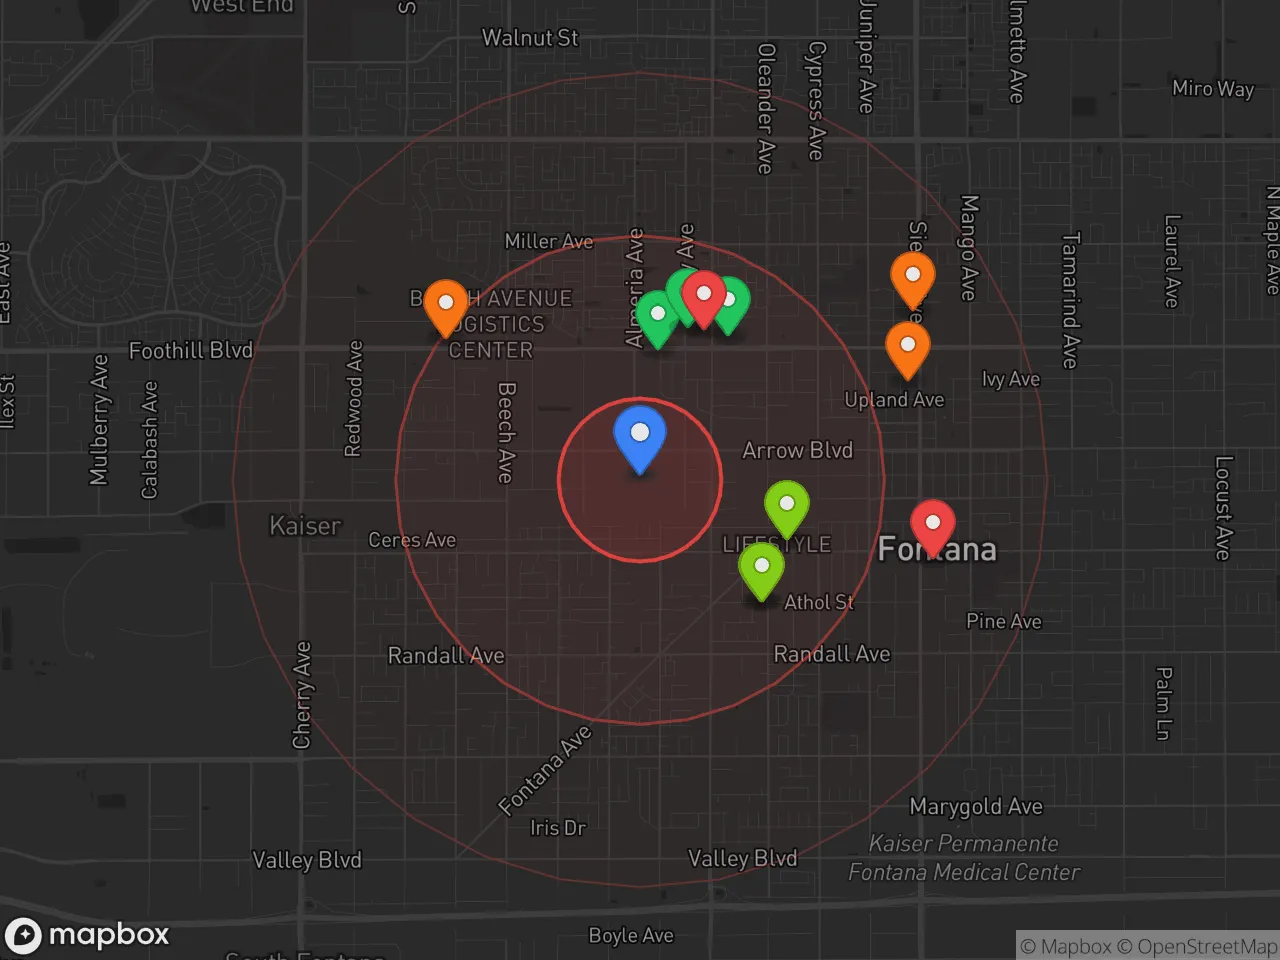
A high quality of life with strong walkability, manageable living costs, healthy neighborhood signals, and solid amenity access.
What does Quality of Life tell us?
Quality of Life blends cost of living, nearby amenities, socioeconomic signals, and neighborhood character. City-level scores represent the whole municipality; individual neighborhoods can differ.
What does this tell us?
Quality of Life blends cost of living, nearby amenities, socioeconomic signals, and neighborhood character. City-level scores represent the whole municipality; individual neighborhoods can differ.
Cost of Living
69% above national average
The Real Cost of Living in Fontana, CA for 2026
| Tier | Individual | Family (4) |
|---|---|---|
| Survival | $28k | $52k |
| Comfortable | $91k | $134k |
| Luxury | $133k+ | $207k+ |
| Elite (Top 5%) | $157k+ | $243k+ |
73%
The Area Signal
A metric tracking the socioeconomic signals of the area.
Hobbies
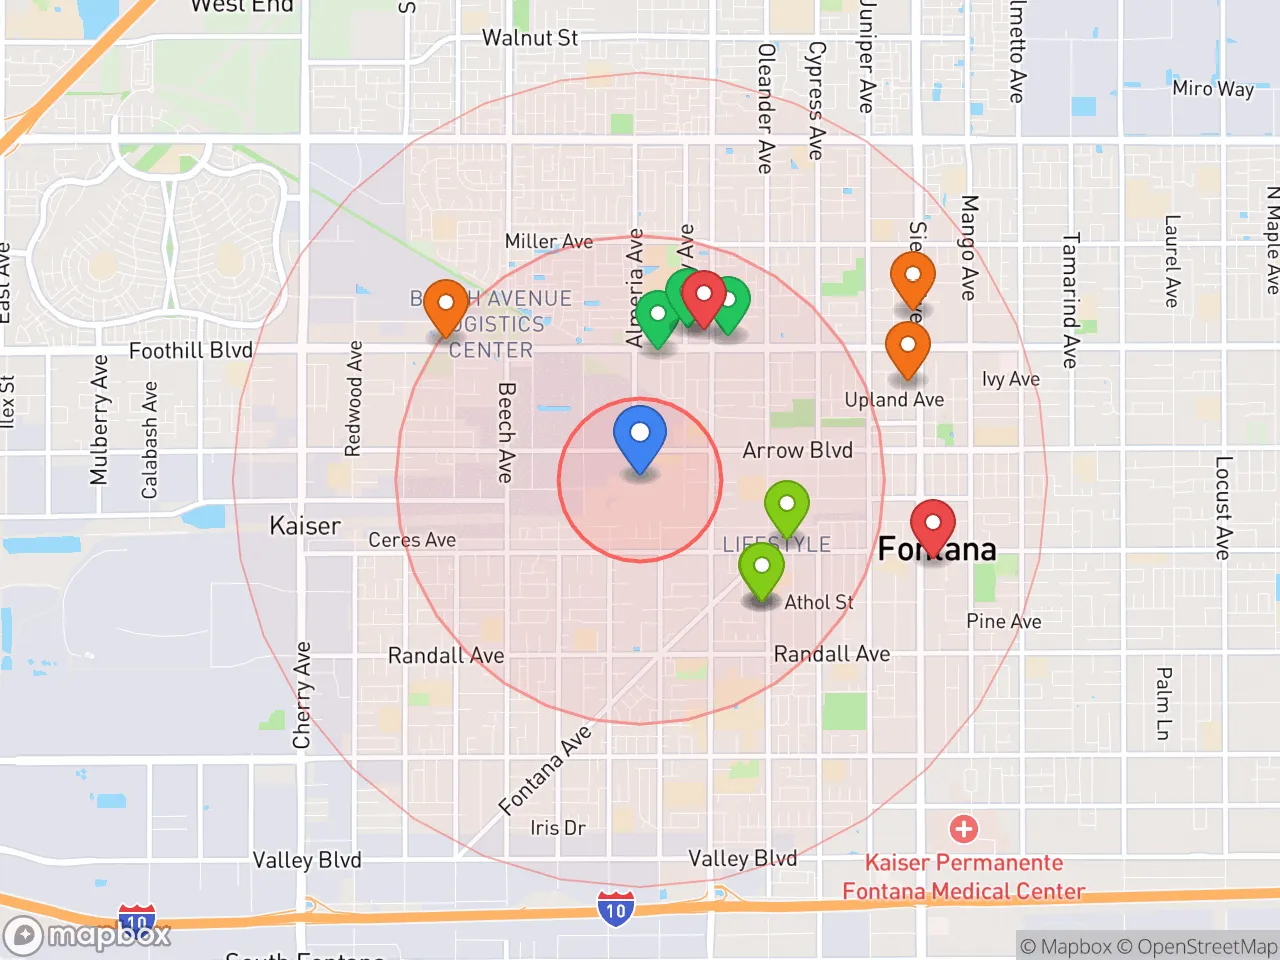
Explore the areaGroceries
9 within 10 miles
Gas
20 within 10 miles
Hospital
20 within 20 miles
Airport
SAN — San Bernardino International
Post Office
USPS — Fontana, CA
Critical Amenities
Quality-of-Life Analysis
Fontana, California, presents a quality-of-life profile that is distinctly middle-class and family-oriented within the high-cost Inland Empire, attracting a diverse population of commuters, tradespeople, and first-time homebuyers priced out of coastal Los Angeles and Orange County. With a cost-of-living index of 169 (69% above the U.S. average), the city is not affluent by regional standards but offers a relatively attainable foothold in Southern California. The typical resident is a working professional or skilled laborer who prioritizes space and newer housing stock over proximity to the beach or urban nightlife, creating a community that feels suburban, industrious, and culturally vibrant.
Cost of living, housing affordability, and how Fontana compares to nearby cities
Fontana’s housing market is the central driver of its affordability calculus, with a median home value of $558,500 and median rent of $1,733. While these figures are steep by national standards, they are roughly 30-40% lower than comparable homes in Los Angeles County cities like Pomona or West Covina, and nearly half the price of median homes in Orange County. The trade-off is a punishing average commute of 33.2 minutes, as many residents travel west to jobs in Ontario, Rancho Cucamonga, or further into LA County. Property taxes remain relatively low due to California’s Proposition 13, but state income tax and higher sales tax (around 8.75%) add to the monthly burden. For a family earning the Inland Empire median household income of roughly $85,000, homeownership is achievable but requires a significant down payment, often sourced from equity in a previous home or family assistance. Renters face a tighter squeeze: the $1,733 median rent consumes about 24% of the area median income, which is manageable but leaves little room for savings compared to lower-cost metros.
Schools, amenities, and what daily life is like for families
Daily life in Fontana revolves around its extensive network of parks, the Fontana Unified School District, and practical retail corridors like the Fontana Auto Center and Victoria Gardens (in neighboring Rancho Cucamonga). The school district serves over 36,000 students and includes several California Distinguished Schools, though overall academic performance lags behind wealthier suburbs like Chino Hills. Families spend weekends at Mary Vagle Nature Center or the Fontana Park Aquatic Center, while the Auto Club Speedway draws motorsports enthusiasts. The city’s industrial base—anchored by logistics warehouses, Kaiser Permanente’s regional operations, and manufacturing—means many residents work locally in trades or healthcare, reducing the need for the long commute that defines other Inland Empire cities. However, the lack of a dense downtown core means most social life centers on strip malls, chain restaurants, and home gatherings. Crime rates are moderate, with property crime slightly above the national average but violent crime lower than in nearby San Bernardino.
Fontana is best suited for families and working professionals who value a newer, larger home with a yard over urban walkability or cultural amenities. The city’s strength lies in its affordability relative to coastal alternatives, its strong sense of community among Latino and Asian populations, and its access to major employment hubs via Interstates 10 and 15. Those who thrive here are willing to trade a longer commute or a quieter social scene for the chance to own a home in a region where that dream is increasingly out of reach. Retirees or single professionals seeking nightlife and transit access will likely find Fontana underwhelming, but for a family seeking a stable, middle-class foothold in Southern California, it remains one of the last viable options.
Crime in Fontana, CA
WARNING: The crime statistics are unreliable for this jurisdiction. Local authorities have either not reported or under reported their data to the FBI. This could be due to bad intentions, incompetence or technical issues. Regardless, we suggest skepticism.
Higher crime rates than 63% of comparable U.S. locations.
Violent CrimeViolent Crime Analysis
Property CrimeProperty Crime Analysis
Crime Analysis
Fontana, California, presents a mixed safety profile that warrants careful consideration for potential residents. With a violent crime rate of 243.2 per 100,000 residents and a property crime rate of 1,131.2 per 100,000, the city's overall crime picture is significantly elevated compared to national benchmarks. These figures are particularly concerning given the broader context of San Bernardino County and the progressive criminal justice policies prevalent throughout California, which critics argue prioritize offender rehabilitation over public safety and victim justice.
Crime in context
Fontana's violent crime rate of 243.2 per 100,000 is roughly 30% higher than the national average of approximately 200 per 100,000, though it sits below the California state average of about 280 per 100,000. The property crime rate of 1,131.2 per 100,000 is nearly double the national average of roughly 600 per 100,000 and aligns closely with the elevated property crime rates seen across the Inland Empire. These numbers reflect a region where progressive district attorneys and judges, operating under state-level reforms like Proposition 47 (which reclassified many thefts as misdemeanors) and zero-bail policies, have created an environment where property crime is often treated as a low-priority offense. This judicial philosophy, while sympathetic to offenders, directly contributes to higher recidivism and more criminals on the street, negatively impacting justice for victims and the public.
What residents experience
For those living in Fontana, property crime is the most tangible safety concern. Vehicle theft, burglary, and package theft are common complaints, with many residents investing in security cameras, alarm systems, and steering wheel locks. Violent crime, while less frequent, is not negligible—incidents of assault and robbery occur, particularly in areas with higher population density and near major commercial corridors like Sierra Avenue and Foothill Boulevard. The city's status as a logistics hub, with massive warehouses and distribution centers along the I-10 and I-210 corridors, also attracts transient populations and creates opportunities for cargo theft and related criminal activity. Residents often report feeling safe during the day in well-trafficked areas but express caution at night, especially in isolated parking lots or near transit stops.
Neighborhood-level variation
Safety in Fontana is not uniform. The northern neighborhoods, particularly those near the San Bernardino National Forest foothills (e.g., the North Fontana area around Summit Avenue), tend to have lower crime rates and a more suburban feel, with larger lots and fewer multifamily units. In contrast, the southern and central parts of the city, especially around the 210 Freeway and the Fontana Metrolink station, experience higher rates of both property and violent crime. The city's gang presence, while less pronounced than in neighboring San Bernardino or Rialto, still contributes to sporadic violence in specific pockets. Prospective residents should research specific zip codes (e.g., 92336 vs. 92335) and consult local police crime maps, as block-by-block variation can be significant. Overall, Fontana's crime landscape is a direct reflection of broader regional policies that have weakened deterrence and enforcement, making it a location where personal vigilance and property security are essential.
* Values derived from national, state, county, city and local statistics and may differ in a specific area. Last updated: 2026-04-30T01:07:56.000Z
Narrative content on this page is AI-generated and may contain mistakes. Verify any details that matter before acting on them.
ReloMaps may earn a commission from affiliate links at no extra cost to you.