
Photo: Wikipedia
Demographics of Frankfort, KY
Affluence Level in Frankfort, KY
A below-average socioeconomic profile. Incomes, home values, and educational attainment trail the U.S., with higher poverty and unemployment.
People of Frankfort, KY
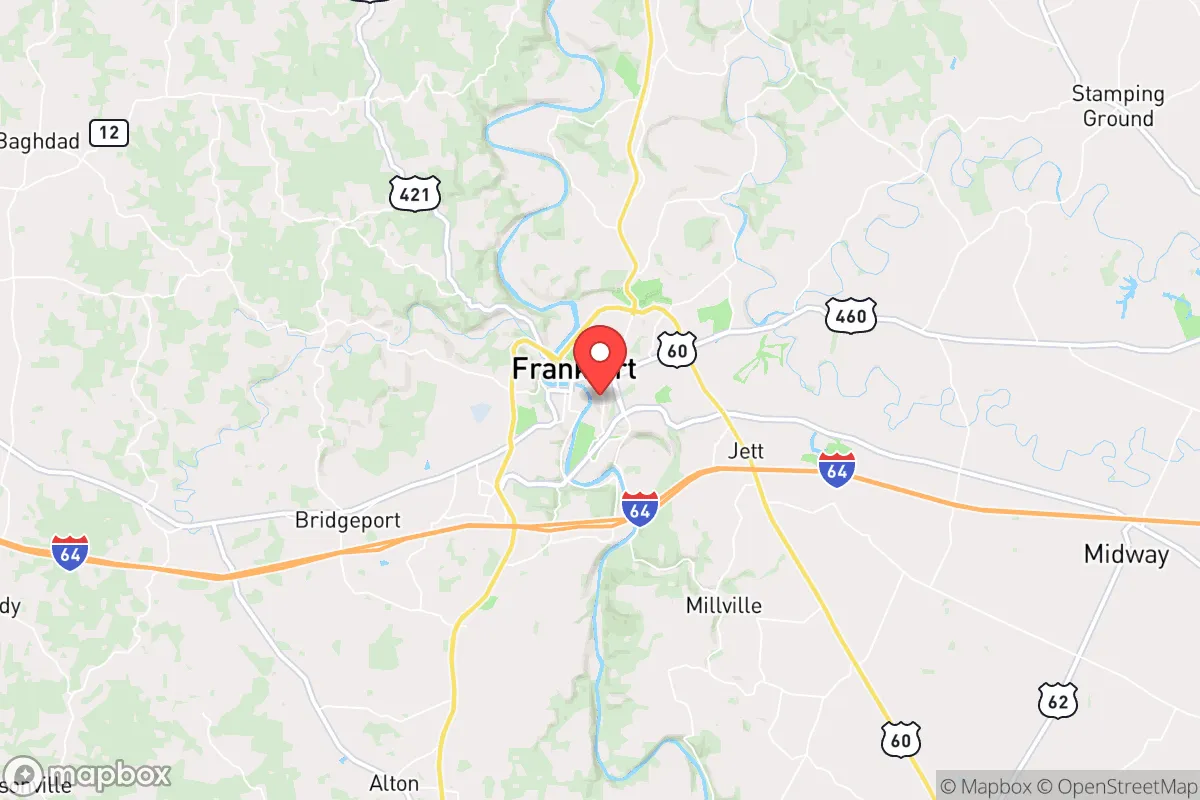
Frankfort, Kentucky, is a small capital city of 28,452 residents where a predominantly white population (72.0%) coexists with a significant Black community (13.9%) and growing Hispanic (6.1%) and Indian-subcontinent (1.7%) populations. The city’s character is shaped by its dual identity as a government and education hub, with a college-educated rate of 27.9% and a foreign-born share of 5.1% that is modest but diversifying. Frankfort feels more like a tight-knit river town than a state capital, with a population density that keeps neighborhoods distinct and walkable. Its people are a blend of long-standing Kentucky families, state employees, and newer immigrant groups settling in specific enclaves.
How the city was settled and grew
Frankfort’s original population was drawn by its location on the Kentucky River and its designation as the state capital in 1792. Early settlers were predominantly of English, Scots-Irish, and German stock, arriving via the Wilderness Road and land grants. The city’s first wave of growth came from government workers, merchants, and enslaved African Americans who built the infrastructure. The historic South Frankfort neighborhood, along the river, became the heart of the working-class white and Black communities, with many Black families settling near the Kentucky River’s floodplain. The West Frankfort district, anchored by the state capitol complex, attracted professionals and politicians. By the mid-20th century, the city’s population peaked near 22,000 in 1960, with a heavily white, native-born character and a Black population concentrated in the Downtown and Bellepoint neighborhoods, the latter a historically Black enclave near the river.
Modern era (post-1965)
After the 1965 Hart-Cellar Act, Frankfort saw modest immigration shifts. The foreign-born share today (5.1%) is below the national average but reflects targeted growth. The Hispanic population (6.1%) began rising in the 1990s, driven by agricultural and construction work, with families settling in East Frankfort near the industrial corridor and along U.S. 60. The Indian-subcontinent community (1.7%) grew more recently, largely tied to professional roles at state government, Kentucky State University, and nearby hospitals; they cluster in the Lakeview and Peaks Mill areas, where newer subdivisions offer larger homes. East/Southeast Asian residents (1.0%) are a smaller, stable group, often connected to the university or medical fields, and live scattered across the city. Domestic in-migration has been dominated by retirees and state workers from other parts of Kentucky, with suburban-style growth in Briarwood and Collins Lane neighborhoods. The Black population (13.9%) has remained steady, with older families still rooted in Bellepoint and South Frankfort, though some have moved to newer subdivisions. The white share (72.0%) has declined slightly from over 80% in 1990, reflecting the diversification of the capital’s workforce.
The future
Frankfort’s population is slowly diversifying but remains predominantly white and native-born. The Hispanic and Indian-subcontinent communities are growing, though from small bases, and are likely to continue expanding as state government and healthcare jobs attract skilled immigrants. The city is not tribalizing into stark enclaves; rather, newer groups are integrating into existing neighborhoods like Lakeview and East Frankfort, while historic Black and white areas like Bellepoint and South Frankfort remain stable but aging. The foreign-born share may rise to 7-8% by 2035, driven by professional immigration and family reunification. The college-educated rate (27.9%) is below the national average, but the presence of Kentucky State University and state government will keep a steady inflow of educated workers. The city is unlikely to see rapid homogenization or fragmentation; instead, it will become a slightly more diverse, middle-income capital with a slower growth pace than nearby Lexington.
For someone moving to Frankfort now, the city offers a stable, small-town feel with a government-anchored economy and a population that is gradually becoming more multicultural. The key neighborhoods to watch are Lakeview for Indian-subcontinent families, East Frankfort for Hispanic growth, and Bellepoint for historic Black community continuity. This is a place where newcomers can find established communities without sharp divides, but where the pace of change is measured and the dominant culture remains rooted in Kentucky traditions.
* Values derived from national, state, county, city and local statistics and may differ in a specific area. Last updated: 2026-04-21T09:13:12.000Z
Narrative content on this page is AI-generated and may contain mistakes. Verify any details that matter before acting on them.
ReloMaps may earn a commission from affiliate links at no extra cost to you.