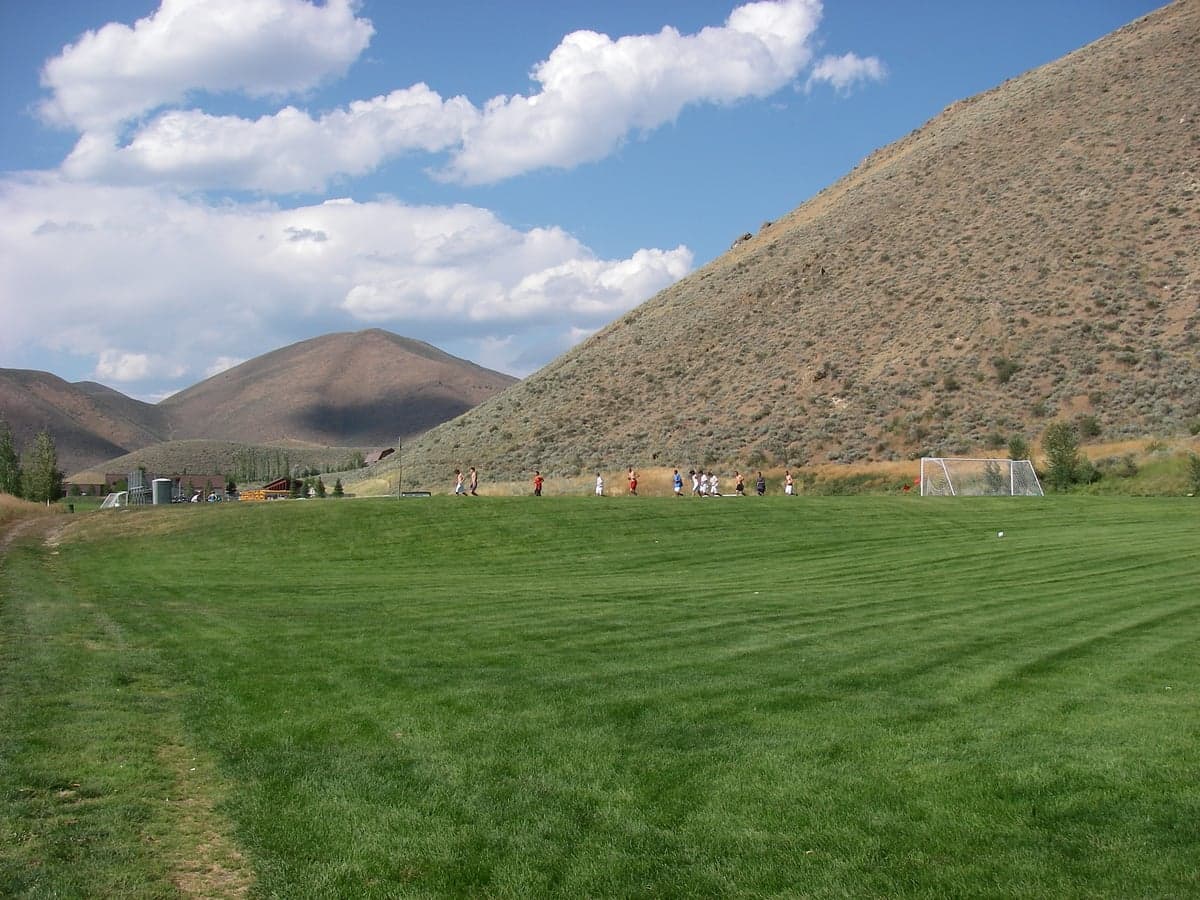
Photo: Wikipedia
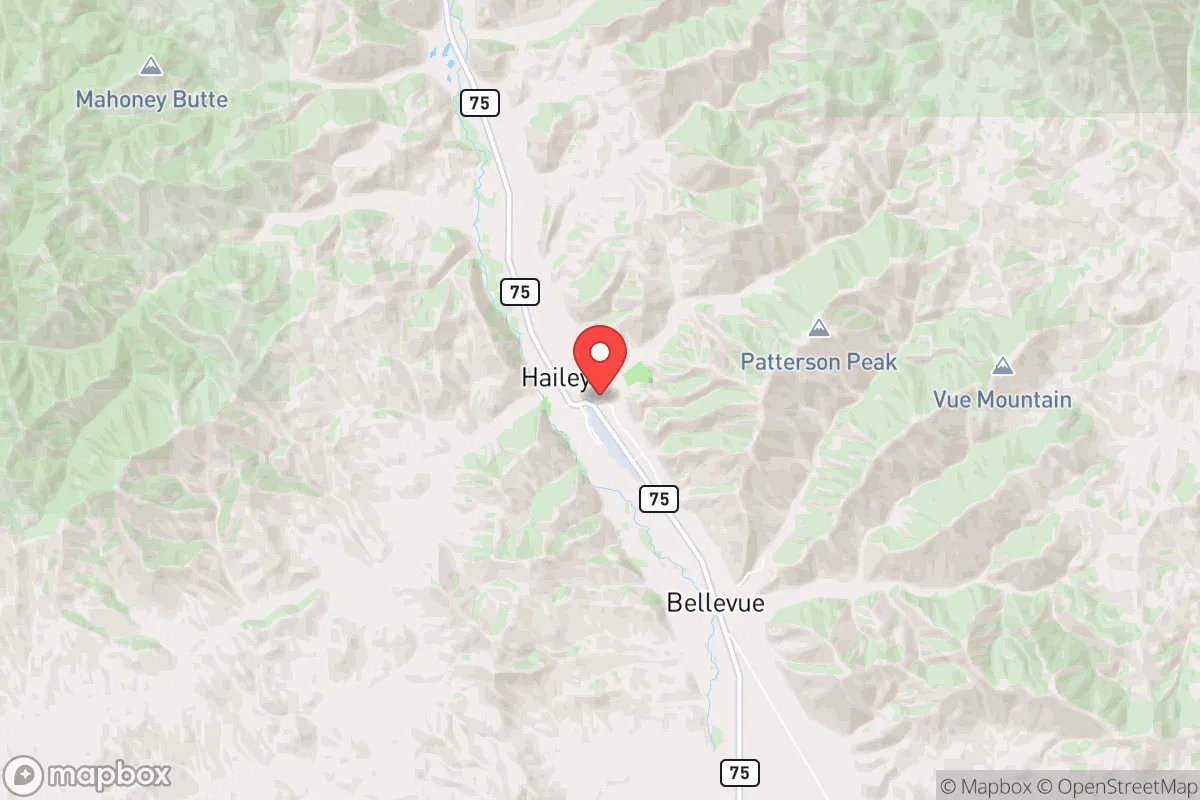
Demographics of Hailey, ID
Affluence Level in Hailey, ID
An upper-middle-class area. Household wealth, education levels, and homeownership run ahead of national benchmarks.
People of Hailey, ID
The people of Hailey, Idaho, today number 9,439, forming a community that is predominantly white (70.2%) with a substantial Hispanic minority (25.9%) and a foreign-born population of 13.7%. This is a college-educated town—42.1% of adults hold a degree—giving it a character that blends working-class roots with an outdoorsy, professional class drawn by the Wood River Valley's recreation economy. Hailey is denser and more ethnically diverse than its pricier neighbor Ketchum, serving as the valley's practical, year-round hub for families and service workers.
How the city was settled and grew
Hailey was founded in 1881 as a silver-mining boomtown, named after John Hailey, a stagecoach operator who saw the potential in the Wood River Valley's mineral wealth. The original population was a mix of Cornish miners, Irish laborers, and Chinese railroad workers who built the narrow-gauge rail line connecting the mines to the outside world. These groups settled in distinct pockets: the Cornish and Irish families clustered along Bullion Street and the blocks around the old Hailey Hotel, while the Chinese community established a small enclave near the railroad depot at the south end of Main Street. By the 1890s, the silver crash sent the mining economy into a tailspin, and the population shrank from a peak of roughly 4,000 to fewer than 1,000 by 1910. The town reinvented itself as an agricultural service center for sheep and cattle ranches, drawing Basque shepherds and a trickle of Midwestern homesteaders who took up land along the Big Wood River. These Basque families settled in the northern reaches of town near what is now Fox Acres, building modest homes and boarding houses for transient herders.
Modern era (post-1965)
The 1965 Hart-Cellar Act had little direct effect on Hailey, as the town remained overwhelmingly white through the 1970s. The real demographic shift began in the 1980s and 1990s, driven by two forces: the expansion of the Sun Valley ski resort and the rise of the service economy that followed. Wealthy second-home buyers from California and the Pacific Northwest pushed Ketchum real estate out of reach for workers, so the service workforce—cooks, housekeepers, lift operators, construction laborers—settled in Hailey. This wave was overwhelmingly Hispanic, primarily from Jalisco and Michoacán, Mexico, and they concentrated in the southwest quadrant of town, around the neighborhoods of Woodside and the area near Hailey Elementary School. By 2000, Hailey's Hispanic share had climbed to roughly 15%, and it has since risen to 25.9%. Meanwhile, a separate domestic in-migration of college-educated professionals—remote workers, environmental consultants, and outdoor-industry entrepreneurs—began arriving after 2010, drawn by the valley's quality of life. These newcomers gravitated to the newer subdivisions on the east side of town, such as the Croy Canyon and Quigley Farm areas, where larger lots and newer homes offered a suburban feel. The result is a town that is not segregated in the formal sense but is tribalizing into distinct enclaves: the Hispanic southwest, the professional east side, and the older, more established white families in the historic core around Bullion Street and the downtown grid.
The future
Hailey's population is projected to grow modestly—perhaps to 11,000–12,000 by 2040—driven by continued in-migration of remote workers and the natural increase of the Hispanic community, which has a younger median age (roughly 28) compared to the white population (mid-40s). The Hispanic share is likely to plateau around 30–32% rather than rise sharply, as housing costs in Hailey are already pushing lower-income families farther south to Bellevue and even to Jerome. The East/Southeast Asian population remains at 0.0%, and the Indian-subcontinent population is also 0.0%, meaning Hailey will remain a binary white-Hispanic town with little other ethnic diversity. The professional east-side enclaves are likely to grow denser as more subdivisions are approved, while the historic core may see gentrification pressure as downtown property values rise. The Hispanic southwest is not assimilating rapidly—Spanish remains the dominant household language in many homes—but second-generation children are increasingly bilingual and attending college, which may accelerate economic integration over the next two decades.
For someone moving to Hailey now, the bottom line is this: you are entering a town that is economically stratified by ethnicity and geography, with a white professional class in the east-side subdivisions and a Hispanic working class in the southwest. The town's identity is not melting-pot but rather a stable, two-group community where each side maintains its own institutions, churches, and social networks. If you are a conservative-leaning family, you will find a strong ranching and outdoor-recreation culture in the historic core and east side, with low crime and good schools, but you should expect a significant Spanish-speaking presence in the schools and service sector. The next decade will likely see more pressure on affordable housing and more tension over growth, but Hailey is unlikely to become either a homogenized resort town or a segregated one—it will remain a functional, if divided, working community at the heart of the Wood River Valley.
* Values derived from national, state, county, city and local statistics and may differ in a specific area. Last updated: 2026-05-01T04:21:54.000Z
Narrative content on this page is AI-generated and may contain mistakes. Verify any details that matter before acting on them.
ReloMaps may earn a commission from affiliate links at no extra cost to you.