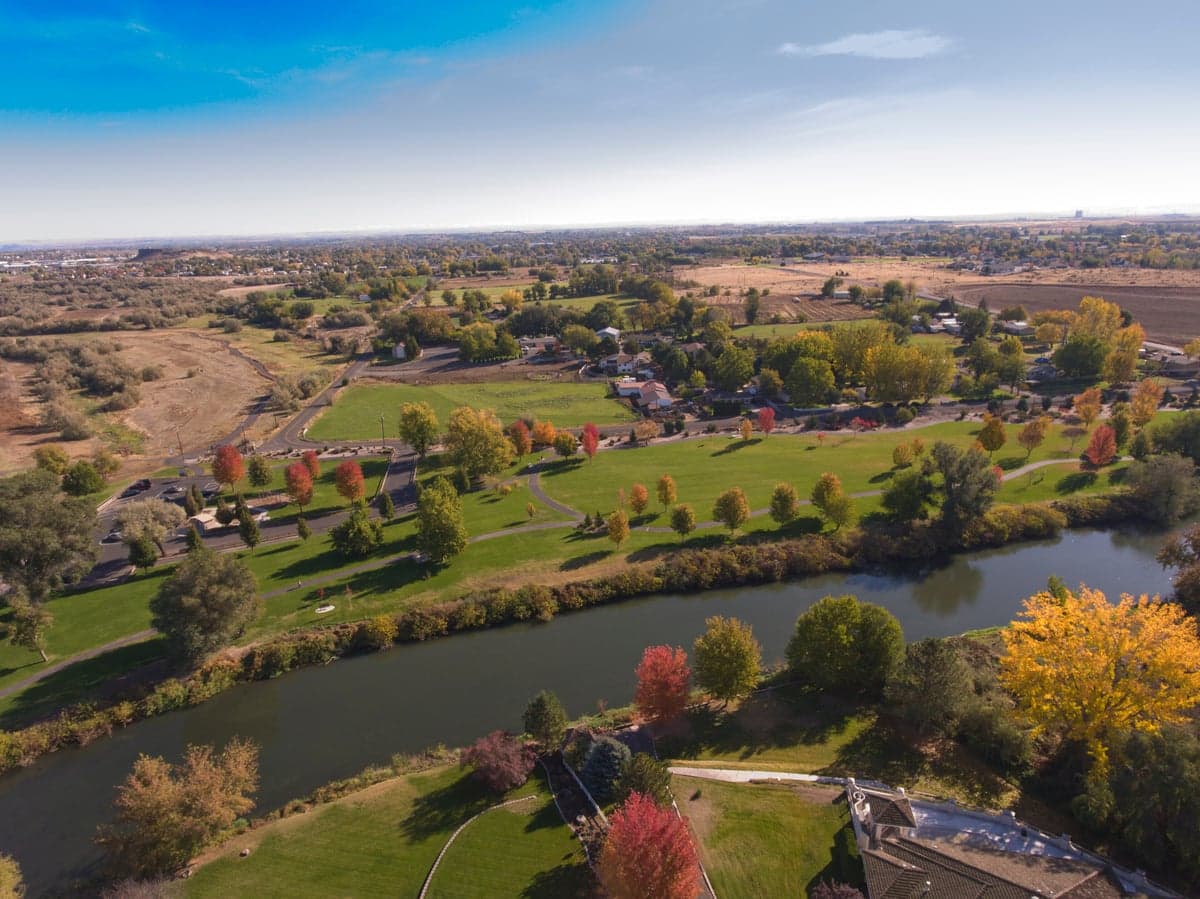
Photo: Wikipedia
Demographics of Hermiston, OR
Affluence Level in Hermiston, OR
A below-average socioeconomic profile. Incomes, home values, and educational attainment trail the U.S., with higher poverty and unemployment.
People of Hermiston, OR
Hermiston, Oregon, is a majority-Hispanic, working-class city of 19,406 where agriculture and food processing anchor the economy and the population. The city’s identity is shaped by a deep-rooted Hispanic majority (52.0%) alongside a substantial white minority (41.5%), with a foreign-born population of 12.4% that is overwhelmingly Mexican and Central American. It is a young, family-oriented community with a low college-attainment rate (15.1%), reflecting its blue-collar character and the centrality of farm and plant labor to daily life. Distinct neighborhoods like West Hermiston and the downtown core mark the historic settlement patterns of the waves that built the city.
How the city was settled and grew
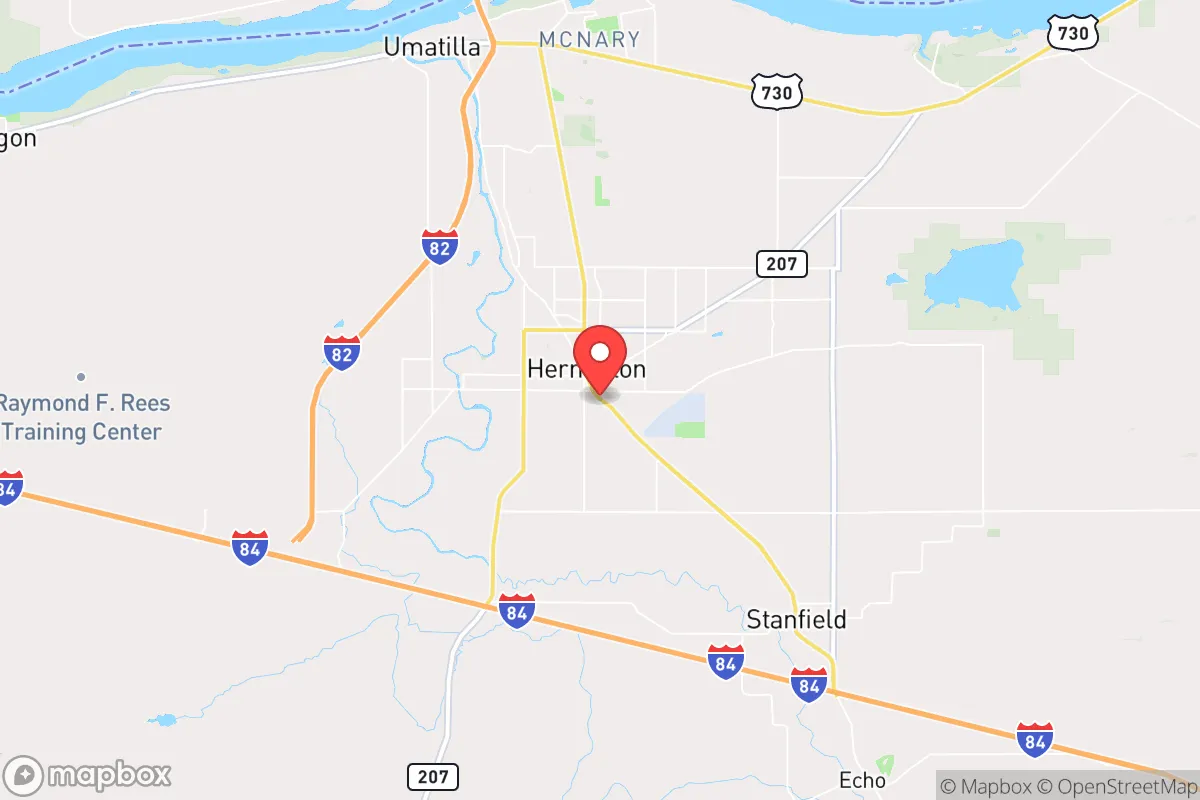
Hermiston was founded in the early 1900s as a railroad town, incorporated in 1907 after the Oregon Railroad and Navigation Company laid tracks through the arid Umatilla Basin. The original white settlers—mostly of Northern European stock—were drawn by the promise of irrigated farmland following the Umatilla Project (1905–1910), which diverted water from the Umatilla River. These early homesteaders built the downtown district around the railroad depot, establishing a grid of modest wood-frame houses and commercial blocks. A second wave arrived during the Great Depression and World War II, when the U.S. Army established the Umatilla Ordnance Depot (now the Umatilla Chemical Depot) just north of town, bringing military personnel and civilian workers. Many of these families settled in the North Hill area, a slightly higher-elevation neighborhood with larger lots and older ranch-style homes. By 1950, Hermiston was a nearly all-white community of roughly 3,000, with a small number of Mexican laborers working seasonally on farms but not yet forming a permanent residential presence.
Modern era (post-1965)
The post-1965 era transformed Hermiston’s demographics. The Immigration and Nationality Act of 1965 opened the door for larger-scale legal immigration from Latin America, and the simultaneous mechanization of agriculture in California pushed many Mexican and Mexican-American farmworkers northward into the Pacific Northwest. Hermiston’s irrigated fields—producing potatoes, onions, and melons—and its expanding food-processing plants (notably Lamb Weston, which opened a major potato-processing facility in the 1970s) created a steady demand for labor. Hispanic families began settling permanently in the South Hermiston and West Hermiston neighborhoods, areas with older, smaller homes and closer proximity to the processing plants and farm fields. By 1990, the Hispanic share had risen to roughly 25%, and by 2020 it had crossed 50%, making Hermiston one of the most Hispanic cities in the Pacific Northwest. The white population, meanwhile, has aged and declined in absolute numbers, with many younger white families moving to newer subdivisions in the East Hermiston area or commuting to jobs in Pendleton or the Tri-Cities (Washington). The East/Southeast Asian share (0.4%) and Indian-subcontinent share (0.2%) remain negligible, reflecting the absence of a tech or professional-services sector that would attract those groups. The Black population (1.1%) is small and largely concentrated in the central corridor near the railroad tracks, a legacy of a brief 1940s–50s influx of African American workers at the depot.
The future
Hermiston’s population is heading toward continued Hispanic growth and white decline, a trend that will likely accelerate over the next 10–20 years. The Hispanic population is young (median age roughly 25, compared to 40+ for whites) and has higher fertility rates, while white out-migration to larger regional cities continues. The foreign-born share (12.4%) is plateauing, suggesting that the Hispanic growth is now driven more by U.S.-born second- and third-generation families than by new immigration. The city is not tribalizing into hostile enclaves—neighborhoods remain mixed, and intermarriage is common—but distinct residential patterns persist: West Hermiston remains heavily Hispanic and working-class, while East Hermiston and newer subdivisions like the Butte (a master-planned development on the eastern edge) are whiter and more affluent. The college-attainment rate (15.1%) is unlikely to rise sharply without a major economic shift, as the dominant employers (Lamb Weston, local farms, the school district) do not require advanced degrees. For a conservative-leaning mover, Hermiston offers a stable, family-oriented, and affordable community with a strong agricultural work ethic, but it is a place where the cultural and linguistic center of gravity is increasingly Hispanic—a reality that shapes everything from school curriculum to local politics.
Bottom line: Hermiston is becoming a majority-Hispanic, blue-collar city with a shrinking white minority and a stable, family-focused social fabric. For someone moving in now, the city offers low housing costs, a strong sense of community, and a straightforward, work-driven lifestyle—but it is not a place of rapid upward mobility or demographic diversity beyond the Hispanic-white axis. The next decade will likely see Hermiston solidify its identity as a Hispanic-majority agricultural hub, with the white population continuing to age and thin out.
* Values derived from national, state, county, city and local statistics and may differ in a specific area. Last updated: 2026-05-29T16:32:23.000Z
Narrative content on this page is AI-generated and may contain mistakes. Verify any details that matter before acting on them.
ReloMaps may earn a commission from affiliate links at no extra cost to you.