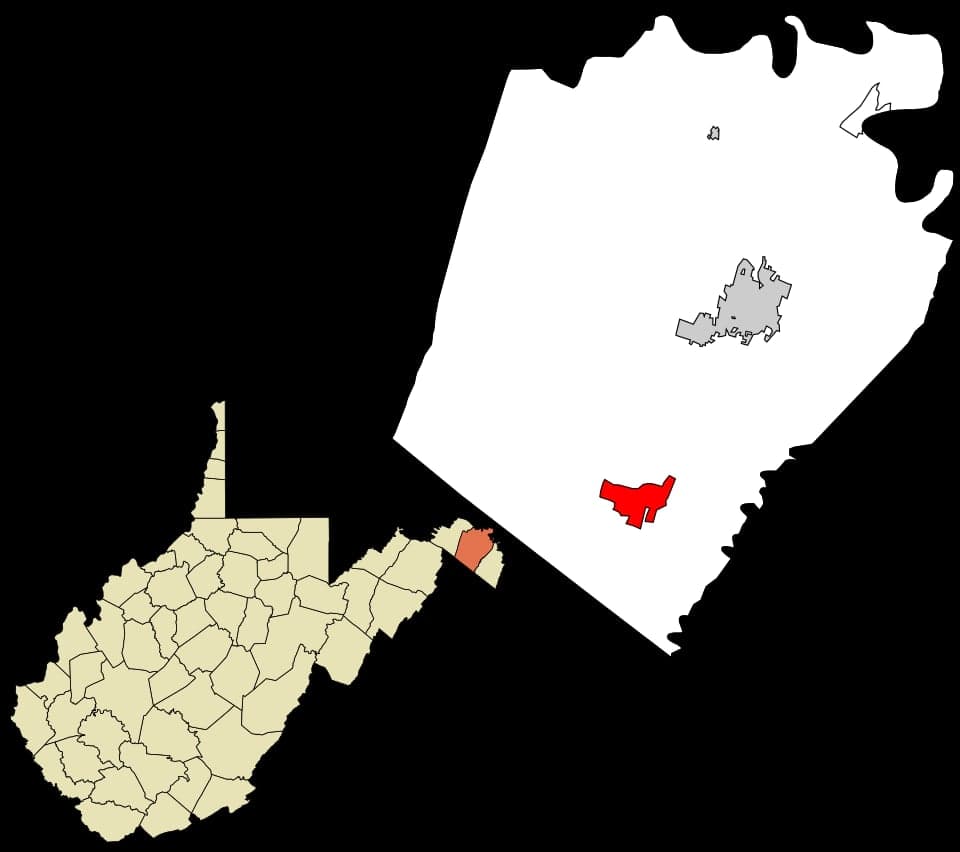
Photo: Wikipedia
Demographics of Inwood, WV
Affluence Level in Inwood, WV
A below-average socioeconomic profile. Incomes, home values, and educational attainment trail the U.S., with higher poverty and unemployment.
People of Inwood, WV
Inwood, West Virginia, is a small, predominantly white community of 2,605 residents where 88.1% of the population identifies as non-Hispanic white, giving it a markedly homogeneous character compared to the national average. The city’s foreign-born population sits at just 0.3%, and its largest minority groups are East/Southeast Asian residents at 3.6% and Hispanic residents at 2.6%, with Indian-subcontinent residents at 1.7% and Black residents at 1.3%. With a college-educated rate of 25.8%, Inwood reflects a working-to-middle-class identity rooted in its agricultural and transportation history, and its population is slowly diversifying through new housing developments rather than historic immigration.
How the city was settled and grew
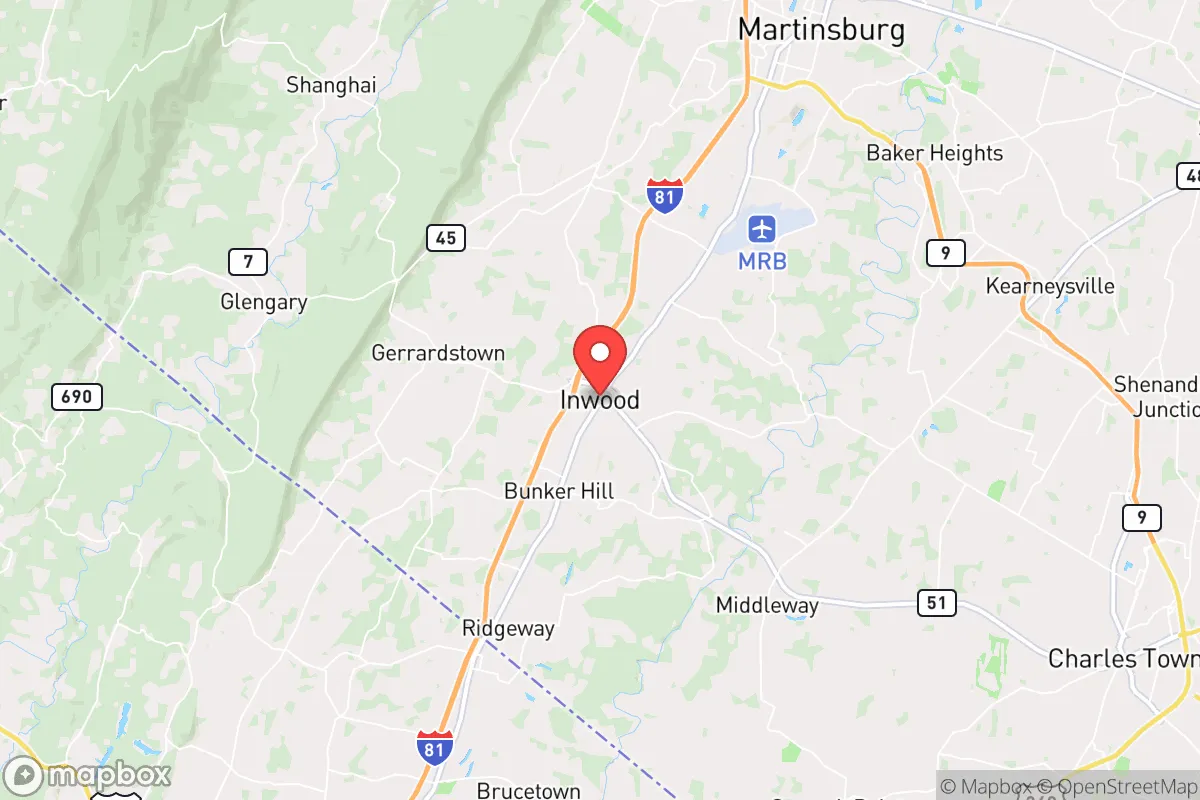
Inwood’s original population was drawn by land grants and the fertile Shenandoah Valley soil in the mid-18th century, primarily by German and Scots-Irish settlers moving west from Pennsylvania and Virginia. These early families established farms along what is now Winchester Avenue and the surrounding rural tracts, forming the nucleus of the community. The arrival of the Baltimore and Ohio Railroad in the 19th century spurred a second wave, bringing Irish laborers who settled near the rail corridor in what is now Old Town Inwood, a historic district centered on the intersection of Winchester Avenue and W.Va. 51. By the early 20th century, the population remained overwhelmingly white and native-born, with small enclaves of African American families working as farmhands and domestic workers in the Mill Creek area south of town. No significant immigrant waves arrived during this period, as Inwood’s economy—based on apple orchards, grain, and livestock—offered limited industrial employment.
Modern era (post-1965)
After the 1965 Hart-Cellar Act, Inwood saw virtually no new foreign-born influx; the 0.3% foreign-born figure today is among the lowest in Berkeley County. Instead, the post-1965 story is one of domestic in-migration from the Washington, D.C., and Baltimore metropolitan areas, as suburban sprawl pushed commuters west along Interstate 81. This wave, accelerating after 2000, brought white middle-class families seeking lower taxes and larger lots into subdivisions like Huntfield and Stonebridge, which now house many of Inwood’s newer residents. The East/Southeast Asian population (3.6%) is a recent phenomenon, concentrated in these same subdivisions, likely tied to professional jobs at the nearby Berkeley Medical Center or the growing logistics sector along I-81. Indian-subcontinent residents (1.7%) are similarly dispersed in newer developments rather than forming an ethnic enclave. The Black population (1.3%) remains small and is scattered, with no distinct neighborhood concentration. Hispanic residents (2.6%) are primarily found in the Inwood Crossing area, where some work in agriculture and construction. The overall effect is a city that has grown from a rural hamlet into a bedroom community, but one where racial and ethnic diversity remains limited and largely tied to recent suburban development.
The future
Inwood’s population is heading toward slow, incremental diversification rather than rapid change. The white share (88.1%) is likely to decline modestly as new subdivisions—such as the planned Mountain View Estates—attract more Asian and Hispanic families from the D.C. metro area, but the foreign-born rate will probably remain below 2% for the next decade. The East/Southeast Asian and Indian-subcontinent communities are growing from a tiny base and are assimilating into the broader suburban fabric, not forming distinct enclaves. Hispanic growth is steady but slow, concentrated in service-sector jobs. The city is not tribalizing into ethnic neighborhoods; rather, it is homogenizing into a mostly white, middle-class commuter suburb with small, dispersed minority populations. For a conservative-leaning mover, Inwood offers a stable, low-crime environment where demographic change is gradual and unlikely to disrupt the existing social character.
Inwood is becoming a quieter, more residential extension of the Eastern Panhandle’s commuter corridor—a place where the population is slowly diversifying through suburban expansion rather than immigration, and where the dominant white, native-born character remains firmly in place. For someone moving in now, the city offers a predictable, low-density lifestyle with minimal cultural friction, but also limited ethnic diversity or international influence.
* Values derived from national, state, county, city and local statistics and may differ in a specific area. Last updated: 2026-04-23T05:58:06.000Z
Narrative content on this page is AI-generated and may contain mistakes. Verify any details that matter before acting on them.
ReloMaps may earn a commission from affiliate links at no extra cost to you.