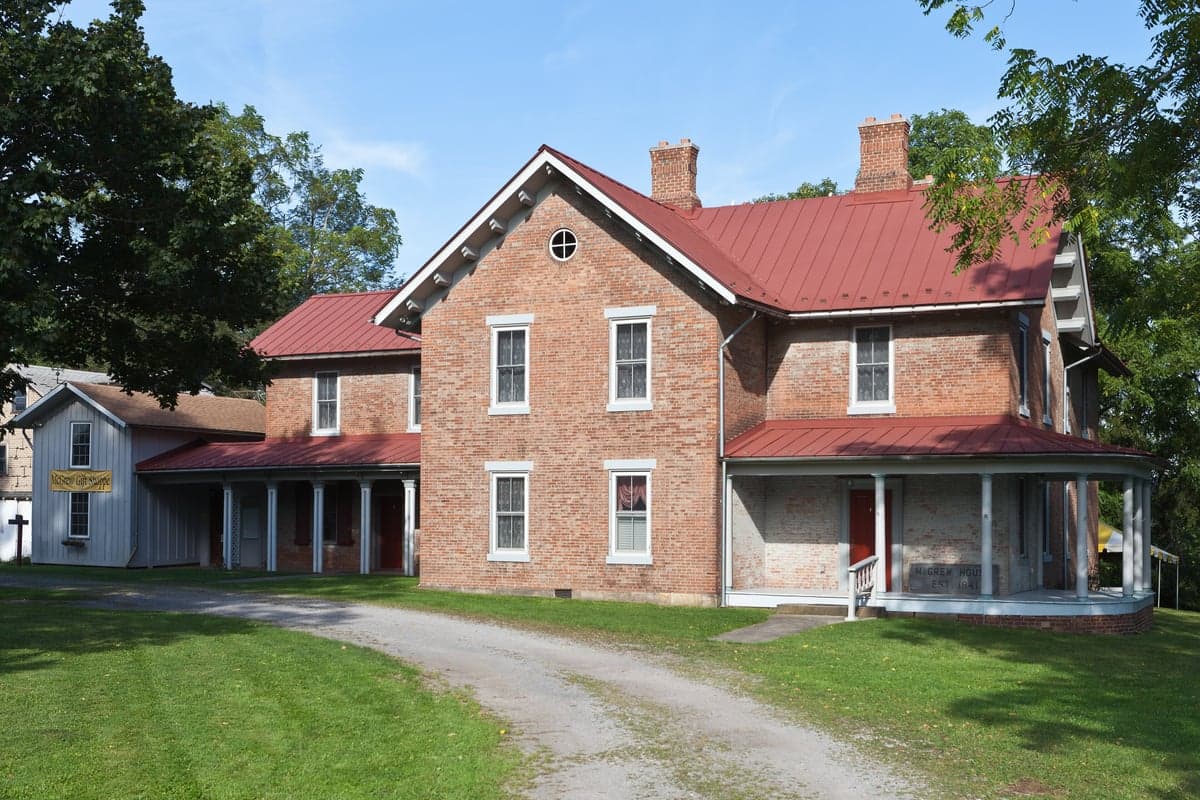
Photo: Wikipedia
Demographics of Kingwood, WV
Affluence Level in Kingwood, WV
A below-average socioeconomic profile. Incomes, home values, and educational attainment trail the U.S., with higher poverty and unemployment.
People of Kingwood, WV
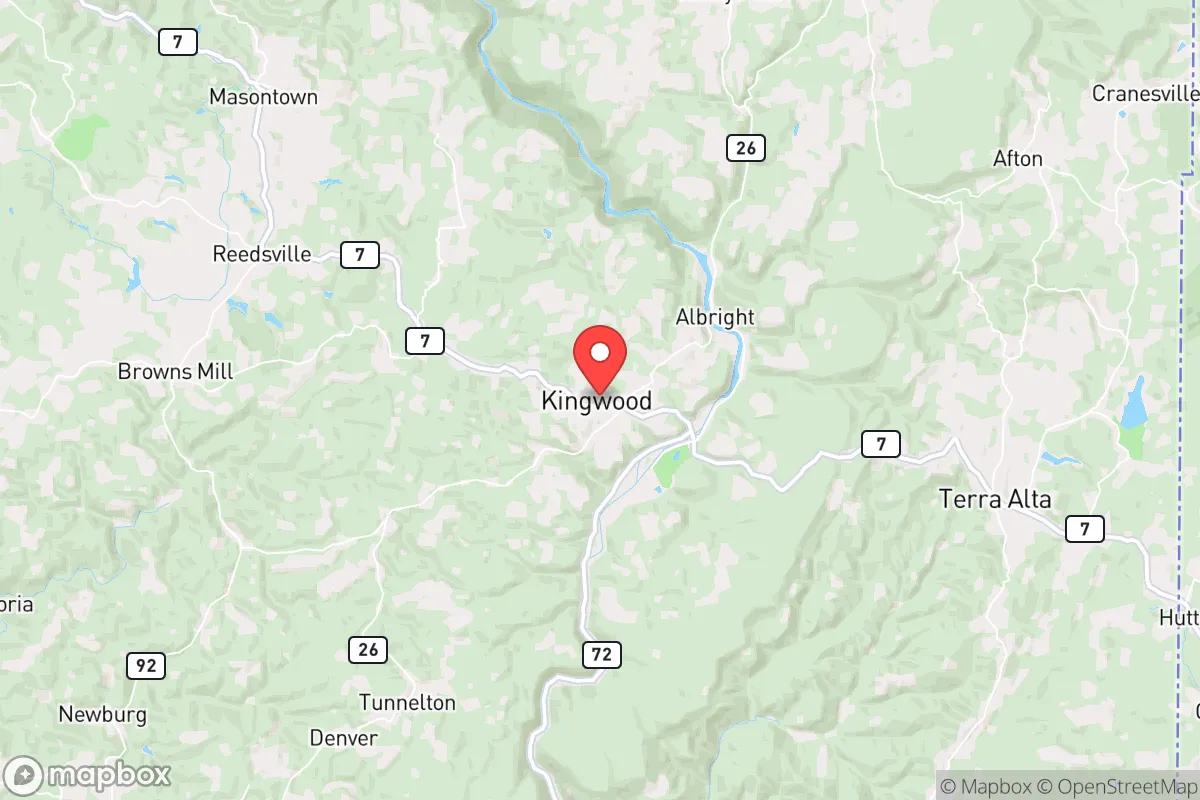
The people of Kingwood, West Virginia, today form a small, predominantly white community of 2,980 residents, characterized by a tight-knit, rural identity rooted in the region's Appalachian heritage. With a population density of roughly 1,200 people per square mile, the city feels more like an extended village than a bustling town, where family names trace back generations. Distinctive markers include a strong sense of local independence, a 31.7% college-educated rate that is above the state average, and a notably low foreign-born population of just 1.8% — making it one of the more ethnically homogeneous places in Preston County.
How the city was settled and grew
Kingwood was founded in 1811 as the county seat of Preston County, strategically located along the Northwestern Turnpike (now US-50) to serve as a trading and government hub for the surrounding agricultural region. The original population was almost entirely of English, Scots-Irish, and German descent, drawn by land grants offered to veterans of the Revolutionary War and the promise of fertile valleys for subsistence farming. These early settlers built the core of what is now Historic Downtown Kingwood, centered around the Preston County Courthouse, with simple frame houses and brick storefronts that still define the district. A second wave arrived in the late 19th and early 20th centuries, driven by the expansion of the Baltimore and Ohio Railroad, which connected Kingwood to larger markets. This period saw the development of South Side, a neighborhood of modest worker cottages built for railroad laborers and small-scale merchants, many of whom were second-generation German and Irish immigrants from the Mid-Atlantic. The coal and timber booms of the 1910s-1930s brought a small influx of Italian and Polish workers to the region, though most settled in nearby coal camps like Bretz and Howesville rather than within Kingwood proper. By 1950, the city's population had stabilized around 2,500, and its ethnic composition remained overwhelmingly white and native-born.
Modern era (post-1965)
The post-1965 period brought little demographic change to Kingwood, as the city was largely bypassed by the immigration waves that reshaped urban America. The 1965 Hart-Cellar Act had minimal impact here: the foreign-born share has never exceeded 2%, and the 1.8% figure today is almost entirely composed of a small Indian-subcontinent community (1.4% of the population) — professionals employed at nearby healthcare facilities or at West Virginia University in Morgantown, 20 miles west. These families have concentrated in the University Heights subdivision, a newer development of single-family homes built in the 1990s and 2000s near the Kingwood Industrial Park. The East/Southeast Asian population is effectively zero (0.0%), and the Hispanic share remains negligible at 0.4%. Domestic in-migration has been the more significant force: retirees and remote workers from the Baltimore-Washington corridor have trickled in since 2010, drawn by low property taxes and a slower pace of life. These newcomers have gravitated toward Deerfield Estates, a wooded subdivision of larger lots on the city's eastern edge, and Pleasant Hill, a semi-rural area with newer custom homes. The Black population, at 2.5%, is largely composed of long-standing families who trace their roots to the small African American communities that existed in Preston County during the coal era, with a cluster still residing in the West End neighborhood near the old railroad depot.
The future
The population of Kingwood is heading toward modest, slow homogenization rather than diversification. The foreign-born share is projected to remain below 3% through 2040, with the Indian-subcontinent community likely plateauing as it assimilates into the broader professional class. The white share, currently 95.1%, will edge slightly lower as a trickle of domestic migrants from the Mid-Atlantic continues, but the city shows no signs of becoming a multi-ethnic enclave. The most notable trend is an aging population: the median age has risen to 43, as younger adults leave for job opportunities in Morgantown or Pittsburgh, while retirees move in. This is creating a subtle tribalization by age and lifestyle — long-term locals in Historic Downtown and South Side versus newer, more affluent arrivals in Deerfield Estates and University Heights. The next 10-20 years will likely see Kingwood become a quieter, older bedroom community for Morgantown, with little racial or ethnic change but a growing cultural divide between established Appalachian families and incoming out-of-state transplants.
For someone moving in now, Kingwood is becoming a stable, predominantly white, and culturally conservative small town where the population is aging and slowly replenishing with domestic migrants rather than diversifying through immigration. The city offers a predictable, low-crime environment with a strong sense of local history, but those seeking significant ethnic or cultural variety will not find it here. The bottom line: Kingwood is a place that holds its character tightly, and new arrivals — especially those from outside the region — will need to actively integrate into existing community networks to feel at home.
* Values derived from national, state, county, city and local statistics and may differ in a specific area. Last updated: 2026-05-01T05:54:05.000Z
Narrative content on this page is AI-generated and may contain mistakes. Verify any details that matter before acting on them.
ReloMaps may earn a commission from affiliate links at no extra cost to you.