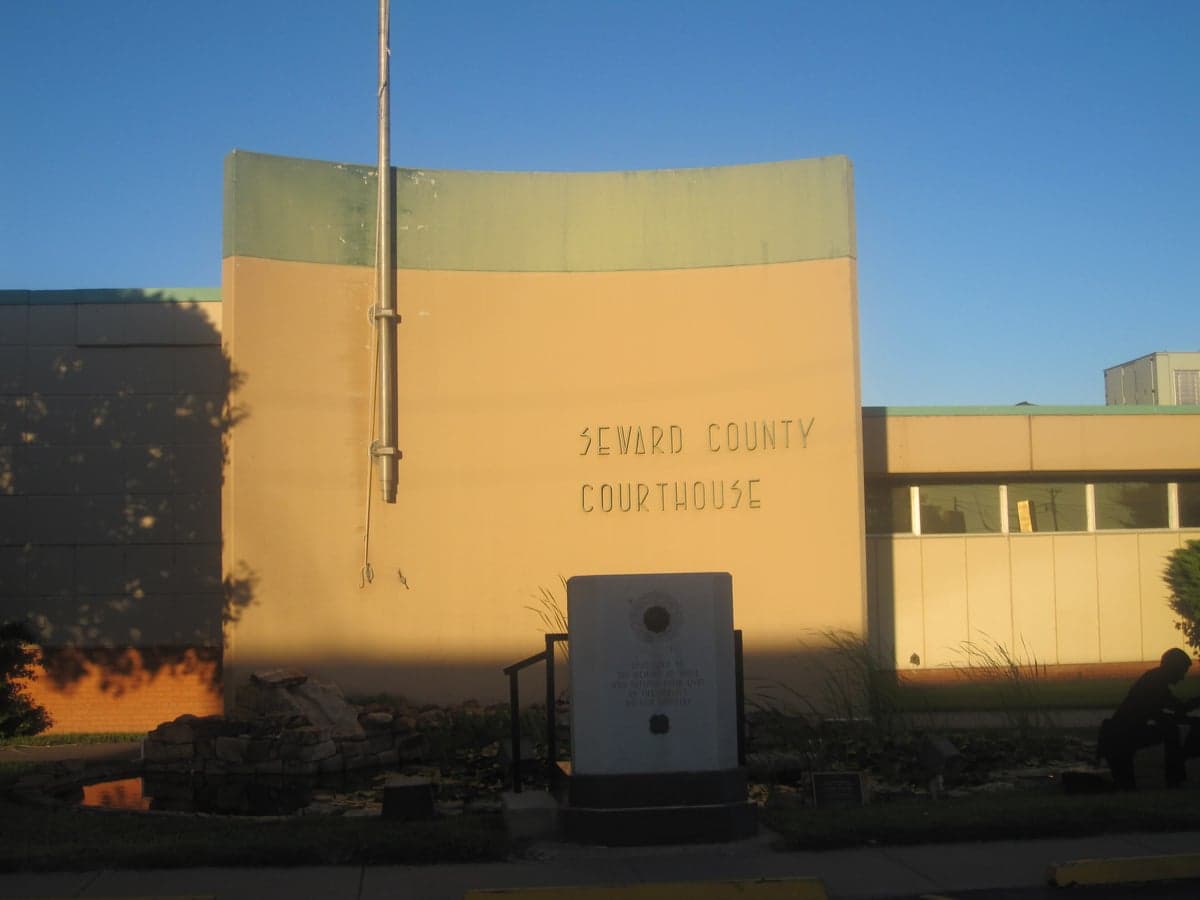
Photo: Wikipedia
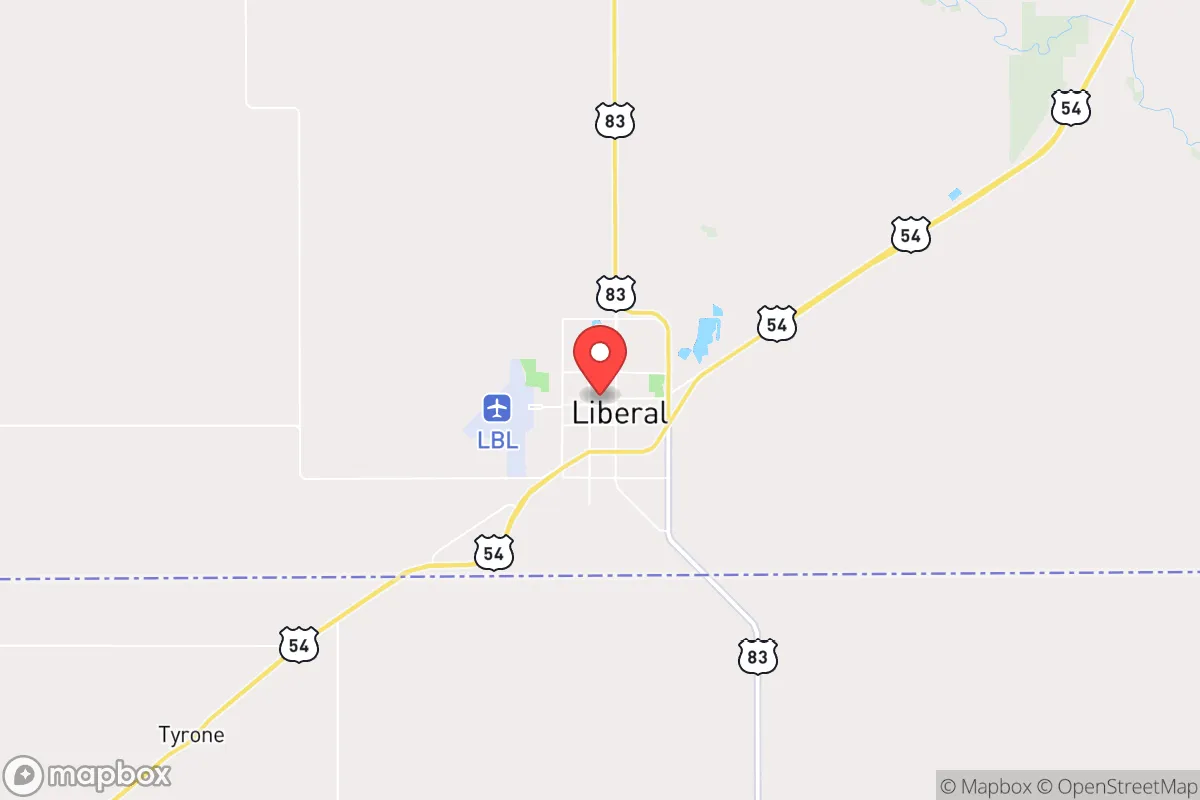
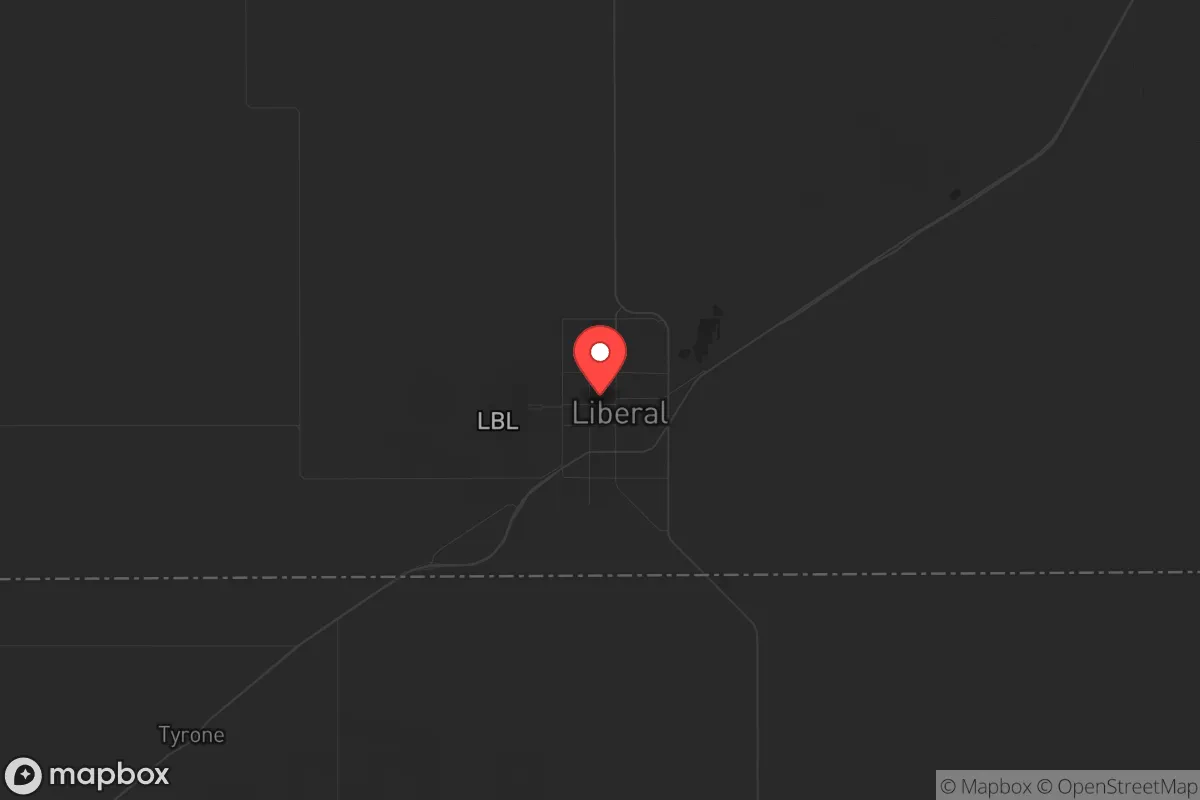
Demographics of Liberal, KS
Affluence Level in Liberal, KS
A middle-class area roughly in line with national averages across income, home values, education, and employment.
People of Liberal, KS
The people of Liberal, Kansas, today form a predominantly Hispanic (68.6%) and young community, with a median age well below the national average and a foreign-born population of 18.4% that is nearly three times the Kansas state rate. This is a working-class city anchored by the National Beef packing plant and a strong agricultural economy, where Spanish is heard as often as English in grocery stores and school hallways. Despite its small size of just over 19,000 residents, Liberal has a distinctly urban density and a bicultural character that sets it apart from the surrounding High Plains. The city’s identity is shaped by a rapid demographic transformation over the past three decades, moving from a predominantly white, rural town to a majority-Hispanic, immigrant-driven community.
How the city was settled and grew
Liberal was founded in 1888 as a railroad town on the Rock Island line, with its earliest settlers being Anglo-American homesteaders drawn by the promise of free land under the Homestead Act and the opportunity to farm wheat and cattle on the shortgrass prairie. The original town site, centered around what is now Downtown Liberal along Kansas Avenue, was built by these early pioneers, who constructed wooden storefronts, grain elevators, and a depot that became the economic heart of the community. A second wave arrived during the Dust Bowl and Great Depression of the 1930s, when displaced farmers from Oklahoma, Texas, and the Deep South—many of them white and poor—moved into the area seeking work on the railroad or in the newly established Liberal Air Base (a World War II training facility). These newcomers settled in modest homes in the North Liberal neighborhood, near the railroad tracks and the airfield, creating a working-class district that remained predominantly white through the 1960s. The city’s growth was modest but steady, reaching about 7,000 residents by 1950, with a population that was nearly 100% white and native-born.
Modern era (post-1965)
The modern demographic transformation of Liberal began in earnest after the Immigration and Nationality Act of 1965, but the real shift accelerated in the 1990s when the National Beef packing plant expanded operations and actively recruited labor from Mexico and Central America. This drew a large wave of Hispanic immigrants—primarily from the Mexican states of Jalisco, Michoacán, and Zacatecas—who settled in the East Liberal neighborhood, a corridor along U.S. Highway 54 where modest ranch-style homes and mobile home parks now house a dense, Spanish-speaking population. By 2000, the Hispanic share of Liberal’s population had risen to 40%, and by 2020 it had reached 68.6%, while the white share fell from 80% in 1990 to 23.5% today. A smaller but notable wave of East/Southeast Asian immigrants (2.3% of the population), primarily Vietnamese and Filipino workers, arrived in the 2000s and concentrated in the South Liberal area near the plant, forming a tight-knit enclave with its own small grocery stores and churches. The Black population (2.9%) is largely composed of African American families who moved from Kansas City and Wichita for packing plant jobs, settling in the West Liberal neighborhood around the community college. The Indian-subcontinent population (0.2%) is negligible and consists mostly of a few professional families working at the hospital or the college. The city’s college-educated share is just 10.6%, reflecting the blue-collar, industrial nature of the local economy.
The future
Liberal’s population is projected to continue growing slowly, driven by natural increase among the Hispanic community (which has a higher birth rate) and ongoing immigration for packing plant work, though the pace of new arrivals has plateaued since 2015 due to tighter border enforcement and automation in the meatpacking industry. The city is not homogenizing; rather, it is tribalizing into distinct enclaves, with the East Liberal Hispanic corridor becoming more culturally and linguistically isolated, while the shrinking white population clusters in North Liberal and newer subdivisions near the golf course. The East/Southeast Asian community in South Liberal is stable but aging, with younger generations moving to Wichita or Denver for better opportunities. Over the next 10-20 years, Liberal will likely become even more Hispanic, potentially reaching 80% of the population, while the white share continues to decline through out-migration and low birth rates. The city’s low educational attainment and reliance on a single industry make it vulnerable to economic shocks, but the strong family networks and work ethic of the immigrant community provide a stabilizing force.
For someone moving in now, Liberal is a place where the dominant culture is Mexican-American, the economy is tied to beef processing, and the schools are majority-Hispanic with significant English-learner populations. It is not a melting pot but a mosaic of distinct neighborhoods, each with its own character and language. The city offers affordable housing and steady work, but newcomers should expect a community where Spanish fluency is increasingly valuable and where the Anglo-American heritage of the early 20th century is now a minority memory.
* Values derived from national, state, county, city and local statistics and may differ in a specific area. Last updated: 2026-04-30T08:23:47.000Z
Narrative content on this page is AI-generated and may contain mistakes. Verify any details that matter before acting on them.
ReloMaps may earn a commission from affiliate links at no extra cost to you.