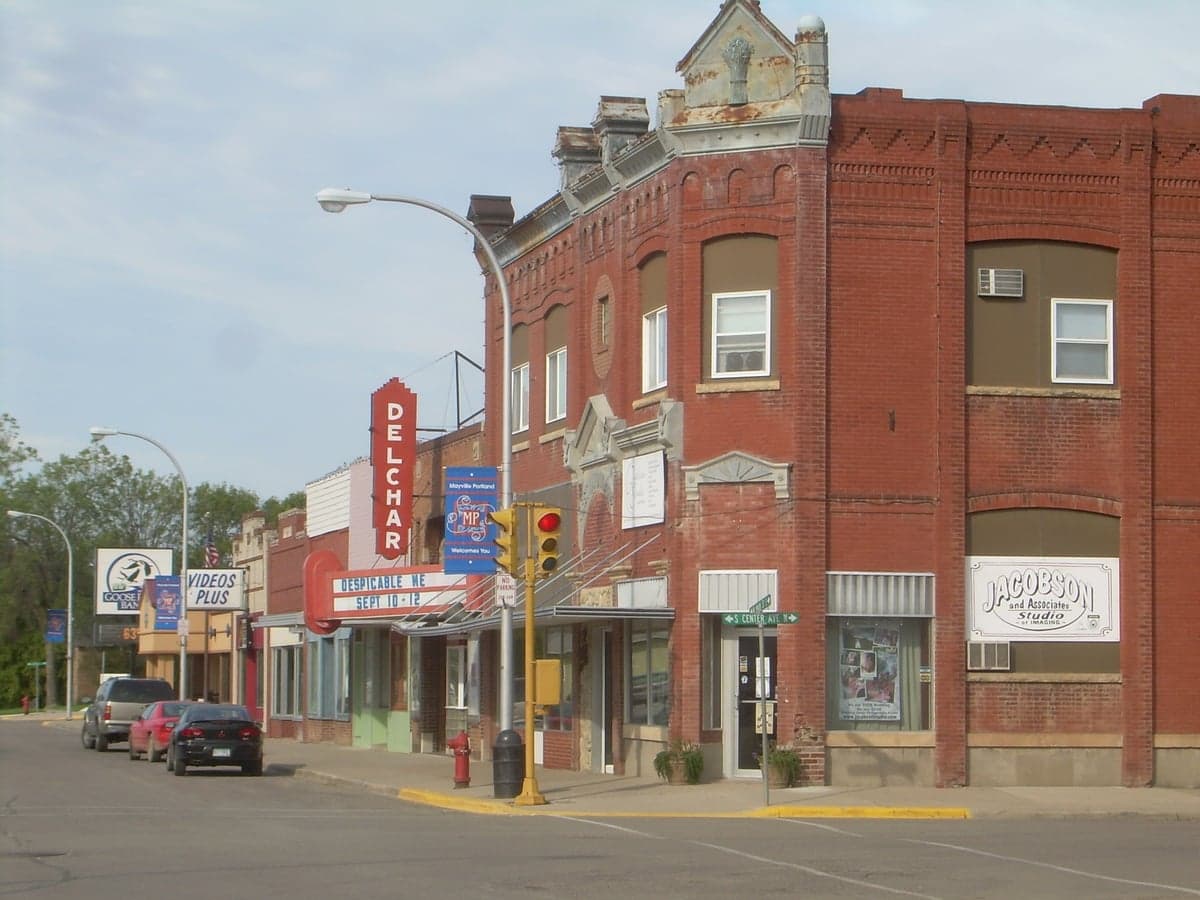
Photo: Wikipedia
Demographics of Mayville, ND
Affluence Level in Mayville, ND
A below-average socioeconomic profile. Incomes, home values, and educational attainment trail the U.S., with higher poverty and unemployment.
People of Mayville, ND
The people of Mayville, North Dakota today number roughly 2,050, forming a tight-knit, predominantly white community with a strong Norwegian-German heritage and a modest but growing Hispanic presence. The city’s character is shaped by its role as a regional education and agricultural hub, anchored by Mayville State University, which lends a small but steady influx of students and faculty. Distinctive identity markers include a high rate of homeownership, a slower pace of life, and a population that is older than the national median, with 27% holding a college degree. The city remains overwhelmingly white (84.5%), with Hispanic residents making up 8.3%, Black residents 3.3%, and a foreign-born share of 4.3%.
How the city was settled and grew
Mayville’s settlement began in the 1880s, driven by the expansion of the Great Northern Railway and the federal Homestead Act, which drew Scandinavian and German immigrants to the rich Red River Valley farmland. The original wave of Norwegian and German settlers established the core of what is now Downtown Mayville, building the first grain elevators, churches, and commercial blocks along Main Street. A second wave of Norwegian immigrants arrived in the 1890s, settling the area around North Hill, a residential district that still retains many of the original wood-frame houses and a strong Lutheran church presence. By 1900, the population had reached roughly 1,000, with the founding of Mayville State Normal School (now Mayville State University) in 1889 drawing a small but steady stream of educators and their families to the Campus District surrounding the university. The city’s growth remained slow but stable through the mid-20th century, with the agricultural economy and the university anchoring the population at around 1,800 by 1950.
Modern era (post-1965)
Following the 1965 Hart-Cellar Act, Mayville saw little direct immigration from new source countries, as the city’s remote location and agricultural base did not attract the waves of Asian or Indian immigrants that reshaped larger cities. Instead, domestic in-migration from rural North Dakota and Minnesota sustained the population, with families moving into the Southside Addition, a post-1970 subdivision of ranch-style homes built to accommodate university staff and agricultural professionals. The Hispanic population began to grow in the 1990s and 2000s, driven by labor demand in the region’s sugar beet and potato processing plants, with many families settling in the West End neighborhood near the industrial corridor along Highway 200. This wave remains modest—Hispanic residents now account for 8.3% of the population—and is largely concentrated in rental housing and older single-family homes in the West End. The Black population, at 3.3%, is small and primarily tied to university faculty and a handful of professional families, with no distinct ethnic enclave. The Asian and Indian populations remain at 0.0%, reflecting the city’s limited draw for these groups.
The future
Mayville’s population is likely to remain stable or decline slightly over the next 10–20 years, as the aging white population (median age around 40) and limited job growth outside agriculture and education constrain in-migration. The Hispanic community is expected to grow slowly, potentially reaching 10–12% of the population, as families already in the West End and Southside Addition expand and attract relatives through chain migration. However, the city is not tribalizing into distinct enclaves; rather, the small scale of the community means that most groups interact daily in the downtown, schools, and university campus. The foreign-born share, currently 4.3%, may rise modestly if the university recruits international students, but the city’s remote location and cold climate will likely prevent rapid diversification. The white population will continue to age, with younger residents often leaving for larger cities after college, a pattern that may accelerate population decline unless new economic drivers emerge.
For someone moving in now, Mayville is becoming a quieter, older, and slightly more diverse version of its historic self—still overwhelmingly Norwegian-German in character, with a small but growing Hispanic presence and a university that keeps the city from becoming a retirement-only town. The neighborhoods to watch are the West End for Hispanic growth and the Campus District for transient student and faculty populations, while Downtown and North Hill remain the stable, historic cores. This is a place for those seeking a low-cost, low-crime, community-oriented lifestyle, not for those expecting rapid demographic change or urban amenities.
* Values derived from national, state, county, city and local statistics and may differ in a specific area. Last updated: 2026-04-19T05:18:50.000Z
Narrative content on this page is AI-generated and may contain mistakes. Verify any details that matter before acting on them.
ReloMaps may earn a commission from affiliate links at no extra cost to you.