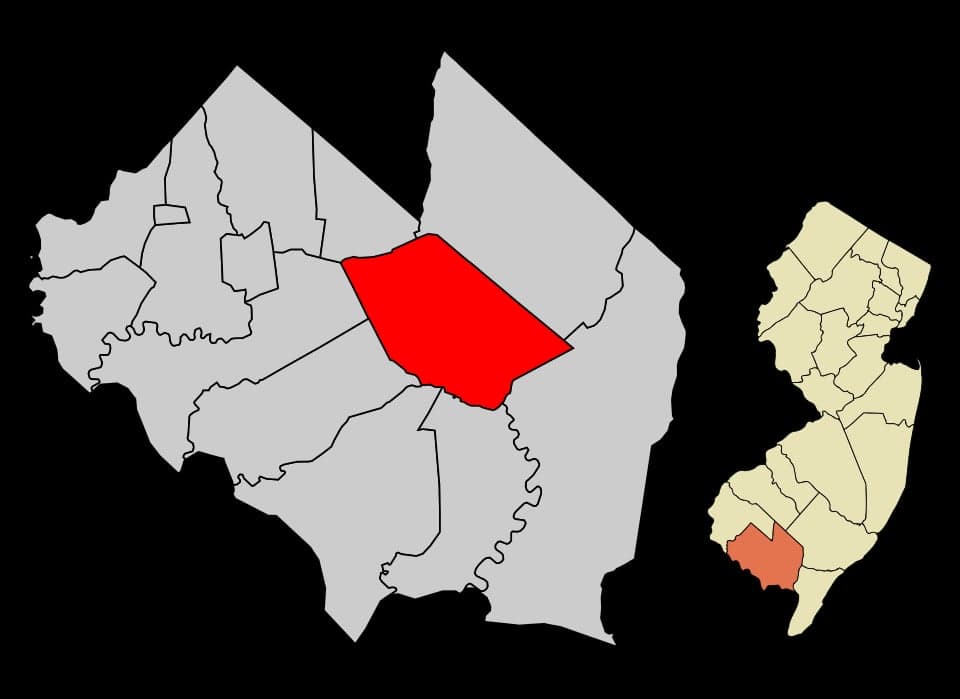
Photo: Wikipedia
Demographics of Millville, NJ
Affluence Level in Millville, NJ
A middle-class area roughly in line with national averages across income, home values, education, and employment.
People of Millville, NJ
The people of Millville, New Jersey, today form a working-class, majority-white city of 27,432 residents, distinguished by a significant Hispanic minority (17.5%) and a substantial Black population (16.3%). The city is notably less diverse than the national average in its foreign-born share (just 3.8%) and has a low college attainment rate (18.5%), reflecting its industrial roots and blue-collar character. Millville’s identity is shaped by a history of glassmaking and manufacturing that drew successive waves of European immigrants, followed by mid-century domestic migration, creating distinct ethnic neighborhoods that persist in modified form today.
How the city was settled and grew
Millville’s population story begins with its founding in 1801 as a planned industrial town along the Maurice River, built around the glass and iron industries. The earliest settlers were English and Scottish artisans recruited to work in the glass factories, establishing the Downtown Millville district as the commercial and residential core. By the mid-19th century, German and Irish immigrants arrived to fill labor shortages in the expanding glassworks and shipbuilding yards, settling in the North Millville neighborhood, where modest row houses and worker cottages still line the streets. The largest wave came between 1880 and 1920, when Italian and Polish immigrants poured in to work in the city’s booming glass factories—at one point, Millville produced a third of all U.S. window glass. These groups concentrated in South Millville and the Buckshutem area, building ethnic churches, social clubs, and social clubs that anchored their communities for generations. The city’s population peaked at around 19,000 in 1930, then stabilized as the glass industry consolidated.
Modern era (post-1965)
The post-1965 period brought two major demographic shifts. First, the decline of the glass industry after the 1970s triggered white flight to surrounding Cumberland County townships, leaving behind an aging, lower-income population in the historic core. Second, the Immigration and Nationality Act of 1965 opened the door for new arrivals, though Millville’s remote location and limited job base meant immigration remained modest. The Hispanic population, now 17.5%, grew primarily through Puerto Rican migration in the 1980s and 1990s, settling in the East Millville neighborhood, where bodegas and Spanish-language churches now dot the commercial strips. The Black population (16.3%) largely traces its roots to the Great Migration of the 1940s–1960s, when African Americans from the rural South moved north for factory work; they concentrated in the West Millville area, near the former industrial plants. The Asian population remains tiny (0.5% East/Southeast Asian; 1.6% Indian subcontinent), with Indian families—many working in healthcare or retail—scattered across the city without a distinct ethnic enclave. The foreign-born share (3.8%) is less than half the national average, reflecting Millville’s limited draw for international migrants compared to New Jersey’s urban centers.
The future
Millville’s population is slowly aging and slightly declining, with a median age of 39.5 and a 2.1% drop since 2020. The white share (57.1%) is shrinking gradually as older residents die or move to retirement communities, while the Hispanic share (17.5%) is growing through natural increase and continued Puerto Rican migration. The Black population is stable, concentrated in West Millville, with little new in-migration. The Indian subcontinent community (1.6%) is small but growing, driven by healthcare workers at the nearby Inspira Medical Center, though they are assimilating into the broader population rather than forming a distinct enclave. The East/Southeast Asian share (0.5%) is flat. The city is not tribalizing into hostile enclaves—neighborhoods remain mixed by class and race—but it is homogenizing economically, with a poverty rate of 18.2% and limited upward mobility. The next decade will likely see continued slow decline in white population, modest Hispanic growth, and a stable Black community, with the city becoming more Hispanic and less white, but remaining overwhelmingly native-born and working-class.
For someone moving in now, Millville offers a low-cost, small-city environment with a strong sense of local history, but limited ethnic diversity and economic opportunity. The population is stable, not booming, and the city’s future hinges on whether new industries can replace the lost manufacturing base that once defined its character. It is becoming a more Hispanic, less white place, but at a pace too slow to fundamentally alter its blue-collar, native-born identity in the near term.
* Values derived from national, state, county, city and local statistics and may differ in a specific area. Last updated: 2026-05-18T03:27:31.000Z
Narrative content on this page is AI-generated and may contain mistakes. Verify any details that matter before acting on them.
ReloMaps may earn a commission from affiliate links at no extra cost to you.