Photo: Wikipedia
Demographics of Moundsville, WV
Affluence Level in Moundsville, WV
A below-average socioeconomic profile. Incomes, home values, and educational attainment trail the U.S., with higher poverty and unemployment.
People of Moundsville, WV
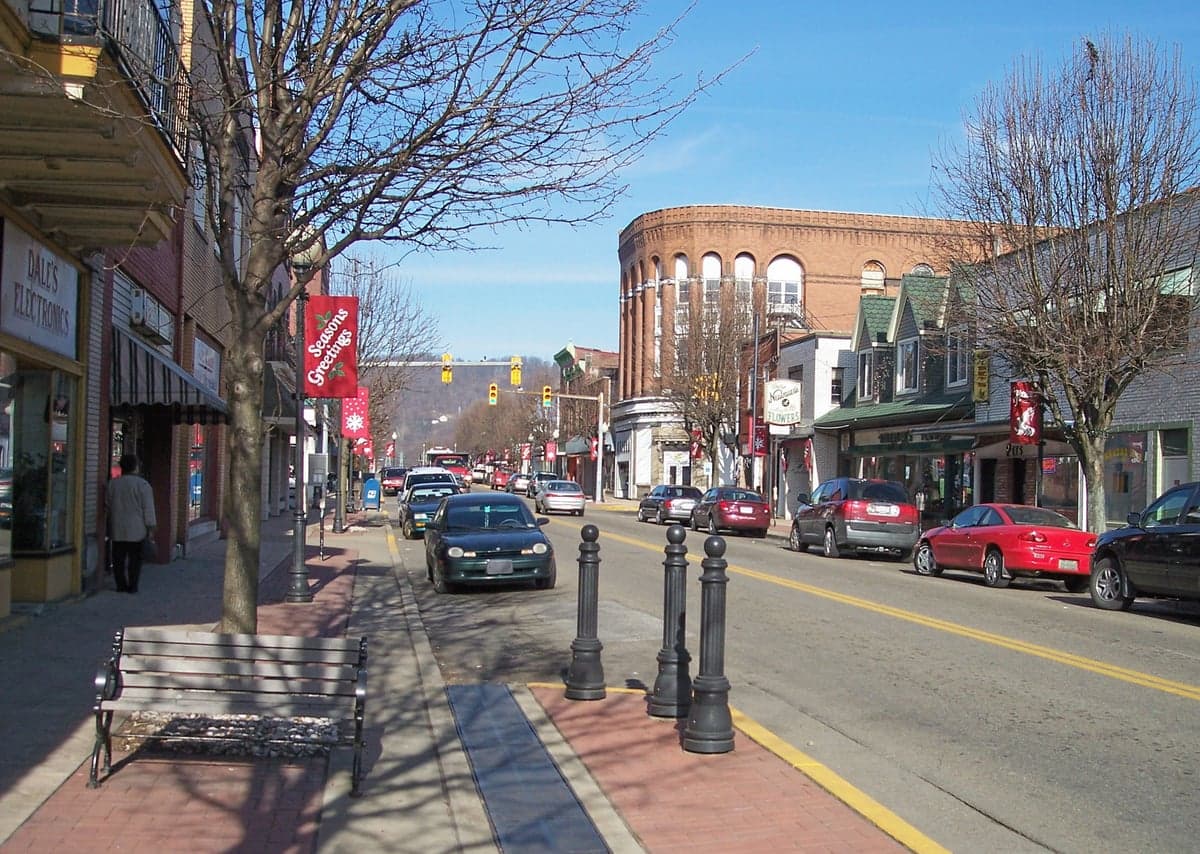
The people of Moundsville, West Virginia today number 7,934, forming one of the most ethnically homogeneous communities in the Ohio Valley. The city is 94.1% white, with a foreign-born population of just 0.1%, and only 12.9% of adults hold a college degree, reflecting a working-class identity rooted in industrial history. Residents describe a tight-knit, family-oriented atmosphere where church and community events anchor social life, and the city’s small size means most people know their neighbors by name. This is a place where population decline has been steady for decades, but those who remain are deeply invested in local traditions and stability.
How the city was settled and grew
Moundsville was founded in the 1770s as a frontier outpost along the Ohio River, named for the ancient Adena burial mound that still stands in the city center. The original white settlers were primarily of English, Scots-Irish, and German stock, drawn by land grants offered to veterans of the Revolutionary War and later by the promise of fertile bottomland. The arrival of the Baltimore and Ohio Railroad in the 1850s and the discovery of natural gas and salt deposits in the late 19th century triggered the first major population wave. Irish immigrants came to dig the railroad tunnels and work the salt furnaces, settling in the First Street and Jefferson Avenue corridor, a working-class district that still bears their imprint in its older frame houses and corner churches. A second wave of Italian and Eastern European immigrants arrived between 1890 and 1920 to work in the burgeoning glass factories and steel mills, clustering in the Grant Avenue and 8th Street area, where Italian social clubs and Catholic parishes remain active today. By 1930, Moundsville had grown to over 14,000 residents, its peak population, with a dense grid of neighborhoods built around the industrial plants along the riverfront.
Modern era (post-1965)
The post-1965 era in Moundsville has been defined by industrial decline and out-migration rather than new immigration. The closure of major employers like the Fostoria Glass Company and the contraction of the coal and steel sectors triggered a steady population loss that continues to this day. The city’s foreign-born population is effectively zero (0.1%), and there has been no significant influx of Hispanic, Asian, or Indian subcontinent residents—Hispanic residents make up just 1.3% of the population, Black residents 0.2%, and East/Southeast Asian and Indian subcontinent residents each account for less than 0.1%. The small number of Hispanic families who have moved in since the 1990s have settled primarily in the Lafayette Avenue and 12th Street area, a lower-cost neighborhood near the former industrial zone. Meanwhile, white residents who could afford to leave have moved to newer subdivisions in nearby Glen Dale or to the outskirts of Wheeling, leaving behind an aging population concentrated in the historic core around Tomlinson Avenue and 4th Street, where many homes date to the 1920s and 1930s. The city’s racial and ethnic composition has barely shifted since 1970, making Moundsville one of the least diverse small cities in the Appalachian region.
The future
The demographic trajectory for Moundsville points toward continued slow decline and further homogenization. The population has fallen from its 1930 peak of 14,000 to under 8,000 today, and projections suggest it could drop below 7,000 by 2040 if current trends hold. The city is not tribalizing into distinct ethnic enclaves because there are simply not enough minority residents to form them; instead, the white population is aging in place, with a median age well above the national average. The small Hispanic community around Lafayette Avenue is likely to grow modestly as service-sector jobs in healthcare and retail attract workers from outside the region, but it will remain a tiny fraction of the total. No significant growth is expected from East/Southeast Asian or Indian subcontinent communities, as the city lacks the professional job base or university presence that typically draws those populations. The Mound View subdivision, a small 1970s-era development on the city’s eastern edge, has seen some younger families move in, but it remains overwhelmingly white and native-born.
For someone moving in now, Moundsville offers a stable, predictable community where the population is shrinking but the social fabric remains intact. The city is becoming more homogeneous, not less, and newcomers will find a place where nearly everyone shares a similar cultural and ethnic background. The trade-off is clear: low cost of living and strong community ties in exchange for limited diversity and a shrinking tax base that strains public services. This is a city that knows exactly what it is, and it is unlikely to change much in the next generation.
* Values derived from national, state, county, city and local statistics and may differ in a specific area. Last updated: 2026-04-23T06:08:29.000Z
Narrative content on this page is AI-generated and may contain mistakes. Verify any details that matter before acting on them.
ReloMaps may earn a commission from affiliate links at no extra cost to you.