Photo: Wikipedia
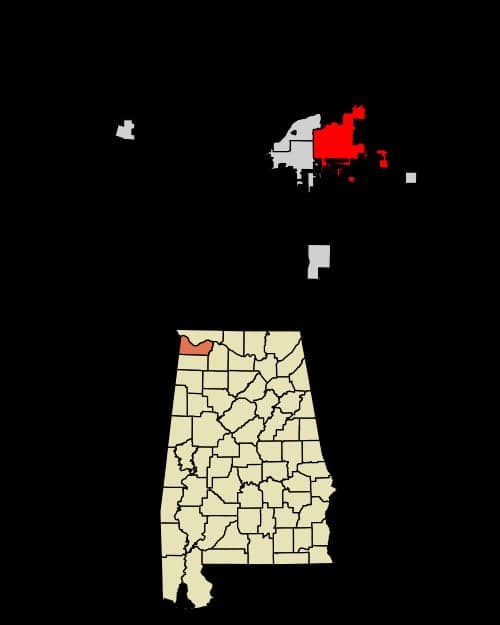
Demographics of Muscle Shoals, AL
Affluence Level in Muscle Shoals, AL
A middle-class area roughly in line with national averages across income, home values, education, and employment.
People of Muscle Shoals, AL
Muscle Shoals, Alabama, is a city of 16,670 residents where the population is predominantly White (77.1%) and Black (13.3%), with a small but growing Hispanic community (4.9%) and very low foreign-born share (1.6%). The city’s identity is rooted in its role as a music-industry powerhouse—the "Hit Recording Capital of the World"—and its working-class, family-oriented character shaped by the Tennessee Valley Authority (TVA) and local manufacturing. With a college-educated rate of 24.4%, slightly below the national average, the population skews practical and blue-collar, concentrated in established subdivisions and historic districts rather than dense urban cores.
How the city was settled and grew
Muscle Shoals was not a colonial-era settlement; it was a product of the 20th century. The area’s name derives from a stretch of the Tennessee River where Native American tribes—primarily the Cherokee and Chickasaw—harvested mussels, but the modern city was incorporated in 1923. The catalyst was the construction of Wilson Dam (completed 1925) by the U.S. Army Corps of Engineers, part of the Muscle Shoals Project that later became the TVA. The dam drew thousands of construction workers, engineers, and their families, many of whom stayed after completion. These early residents—largely White migrants from rural Alabama and Tennessee—settled in the Wilson Dam Village area, a planned community of bungalows and duplexes built for TVA employees. By the 1930s, the city’s population was overwhelmingly White and native-born, with a small Black population concentrated in the Southside neighborhood, near the railroad tracks and industrial zones. The post-World War II boom brought another wave: returning veterans and workers for the Reynolds Metals aluminum plant (opened 1941) and the Ford Motor Company glass plant (opened 1959). These new arrivals filled subdivisions like Montgomery Addition and Lakeview Estates, solidifying Muscle Shoals as a White, middle-class, manufacturing-dependent suburb of Florence.
Modern era (post-1965)
The 1965 Hart-Cellar Act had minimal direct impact on Muscle Shoals; the foreign-born population remains just 1.6% today, and the city never attracted significant immigrant waves. Instead, the post-1965 story is one of domestic in-migration and suburbanization. The rise of the Muscle Shoals Sound Studio (opened 1969) and FAME Studios drew a transient population of musicians, producers, and engineers—mostly White and Black Americans from the South—but few settled permanently. The Black population, which had been a small minority through the 1960s, grew modestly as families moved from rural Colbert and Lauderdale counties into the Southside and East Muscle Shoals areas, seeking jobs at the city’s expanding industrial plants (e.g., the 1970s expansion of the TVA’s Colbert Steam Plant). The Hispanic population began a slow increase in the 1990s, driven by labor demand in poultry processing (e.g., Wayne Farms in nearby Uniontown) and construction, settling primarily in West Muscle Shoals near Highway 20, where rental housing is more available. The Asian population (0.4% East/Southeast Asian, 0.8% Indian subcontinent) remains negligible, concentrated among a handful of professionals at the University of North Alabama in Florence or at local hospitals. The city’s overall growth has been steady but slow—from about 10,000 in 1980 to 16,670 today—driven by White families moving from more expensive or crime-ridden parts of the Shoals region, not by international migration.
The future
The population is heading toward gradual homogenization, not tribalization. Muscle Shoals is not experiencing the rapid diversification seen in larger Southern metros; the White share (77.1%) is stable, and the Black share (13.3%) is plateauing as younger Black residents move to Huntsville or Nashville for better job markets. The Hispanic share (4.9%) is the only segment likely to grow, driven by second-generation families and continued demand in construction and food processing, but it will remain a small minority—likely reaching 7-8% by 2035. The East/Southeast Asian and Indian populations are too small to form distinct enclaves and will remain scattered professionals. The city’s low foreign-born rate and lack of major immigrant-attracting industries mean it will stay overwhelmingly native-born and English-speaking. New subdivisions like Riverbend and Woodland Hills are filling with White families from within the Shoals region, reinforcing the city’s character as a quiet, family-oriented suburb. The biggest demographic shift may be aging: the median age is rising as younger adults leave for larger cities, and the 65+ cohort is growing.
For a conservative-leaning individual or family moving in now, Muscle Shoals offers a stable, culturally homogeneous environment with low crime and strong community ties. The city is becoming more of a bedroom community for workers commuting to Florence, Sheffield, or Huntsville, rather than a destination for newcomers from outside the region. The population is not diversifying rapidly, and the next decade will likely see continued slow growth, a slightly older median age, and a modest uptick in Hispanic residents—but no fundamental change to the city’s White-majority, native-born, family-centric identity.
* Values derived from national, state, county, city and local statistics and may differ in a specific area. Last updated: 2026-04-19T19:01:00.000Z
Narrative content on this page is AI-generated and may contain mistakes. Verify any details that matter before acting on them.
ReloMaps may earn a commission from affiliate links at no extra cost to you.