
Photo: Wikipedia
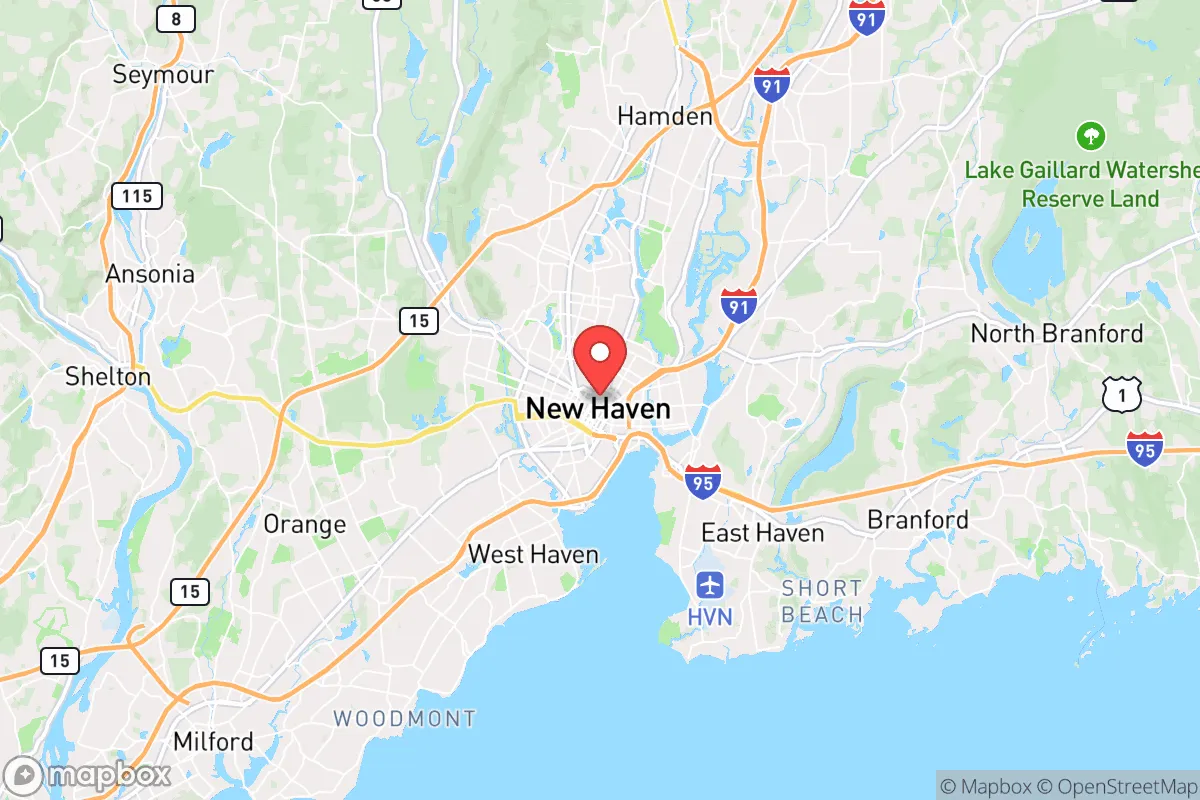
Quality of Life in New Haven, CT
Above-average quality of iife. The area offers a reasonable cost of living, decent mobility, and a mix of neighborhood amenities.
What does Quality of Life tell us?
Quality of Life blends cost of living, nearby amenities, socioeconomic signals, and neighborhood character. City-level scores represent the whole municipality; individual neighborhoods can differ.
What does this tell us?
Quality of Life blends cost of living, nearby amenities, socioeconomic signals, and neighborhood character. City-level scores represent the whole municipality; individual neighborhoods can differ.
Cost of Living
10% above national average
The Real Cost of Living in New Haven, CT for 2026
| Tier | Individual | Family (4) |
|---|---|---|
| Survival | $23k | $43k |
| Comfortable | $48k | $71k |
| Luxury | $97k+ | $151k+ |
| Elite (Top 5%) | $149k+ | $231k+ |
76%
The Area Signal
A metric tracking the socioeconomic signals of the area.
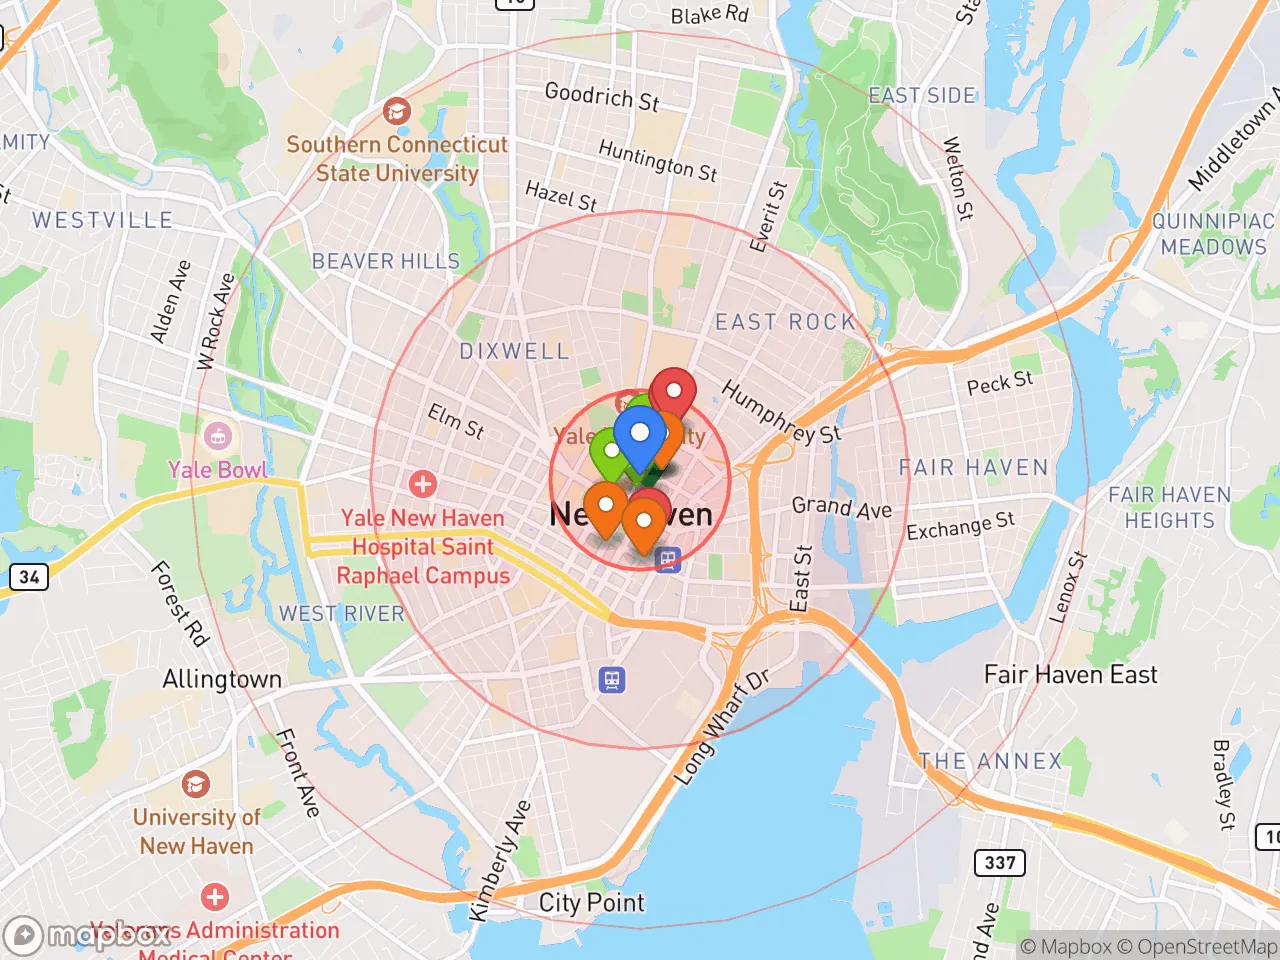
Hobbies
Explore the areaGroceries
6 within 10 miles
Gas
20 within 10 miles
Hospital
19 within 20 miles
Airport
JFK — John F. Kennedy International
Post Office
USPS — New Haven, CT
Critical Amenities
Quality-of-Life Analysis
New Haven, Connecticut, presents a distinctive quality-of-life profile that blends urban energy with a more moderate cost structure than its affluent neighbors. With a cost-of-living index of 110 (10% above the national average), the city is notably more affordable than nearby suburbs like Greenwich or Darien, yet it remains pricier than much of inland Connecticut. The population is a mix of Yale University faculty and students, long-term working-class residents, and a growing cohort of young professionals and artists drawn by the city’s cultural density and relatively accessible housing market.
Cost of living, housing affordability, and how New Haven compares to nearby areas
New Haven’s housing market is a key differentiator in the region. The median home value sits at $249,000, which is dramatically lower than the Connecticut state median of roughly $380,000 and a fraction of the $1 million-plus averages seen in Fairfield County suburbs. Median rent is $1,442, making it one of the most affordable urban rental markets in the Northeast for a city of its size. However, these figures mask significant variation: East Rock and Wooster Square command higher prices, while neighborhoods like Fair Haven and Newhallville offer entry points below $200,000. The average commute of 21 minutes is notably short for the region—far less than the 45-minute average for commuters heading into New York City from Stamford or New Haven’s own suburbs. This short commute, combined with lower housing costs, makes New Haven attractive for workers at Yale New Haven Hospital, Southern Connecticut State University, and the growing bioscience sector along the Mill River corridor. Property taxes in New Haven are high (around 42 mills), which partially offsets the lower home prices, but overall monthly carrying costs remain well below those in West Hartford or Madison.
Amenities, schools, and what daily life is really like for residents
Daily life in New Haven revolves around its walkable, neighborhood-based urbanism. The city boasts over a dozen distinct neighborhoods, each with its own commercial strip—Chapel Street in the downtown core, State Street in East Rock, and Grand Avenue in Fair Haven. The public school system is a mixed bag: Wilbur Cross and Hillhouse High Schools have graduation rates around 75-80%, while the ACES magnet schools and the New Haven Public Schools’ interdistrict magnet program draw families from across the region. For higher education, Yale University is the dominant cultural and economic force, offering free museum access, public lectures, and the Yale University Art Gallery. The city’s dining scene is nationally recognized, with James Beard Award-winning restaurants like Union League Café and Miya’s alongside a thriving pizza culture (Frank Pepe, Sally’s, Modern Apizza). Parks are abundant: East Rock Park provides hiking and panoramic views, while Lighthouse Point Park offers beach access on Long Island Sound. The rhythm of life is faster than a typical Connecticut suburb but slower than New York City—residents often describe it as a “small big city” where you can walk to a concert at College Street Music Hall, grab groceries at Edge of the Market, and be home in 15 minutes.
New Haven is best suited for people who value urban amenities, cultural density, and walkability but cannot afford or do not want the costs of Boston or New York. It works well for academics, healthcare professionals, and creative-class workers who prioritize short commutes and a lively street life over suburban yard space. Families should weigh the school system carefully—many opt for magnet schools or private options—while empty-nesters and young professionals will find the city’s affordability and cultural offerings a strong draw. The city’s challenges—higher crime rates in certain neighborhoods, aging infrastructure, and property tax burdens—are real, but for those who align with its urban, intellectual, and diverse character, New Haven offers a quality of life that punches well above its price point.
Crime in New Haven, CT
Higher crime rates than 72% of comparable U.S. locations.
Violent CrimeViolent Crime Analysis
Property CrimeProperty Crime Analysis
Crime Analysis
New Haven, Connecticut, reports a violent crime rate of 396.5 incidents per 100,000 residents and a property crime rate of 3,114.2 per 100,000, placing it among the higher-risk cities in the Northeast for its size. While the city benefits from the stabilizing presence of Yale University and its associated hospital system, overall safety is undermined by a local criminal justice environment shaped by progressive policies that prioritize offender rehabilitation over public protection. Prospective residents should weigh these statistics and policy realities carefully when considering a move to the Elm City.
Crime in context
New Haven’s violent crime rate is roughly 2.5 times the national average and significantly higher than Connecticut’s statewide rate of approximately 200 per 100,000. Property crime in New Haven also exceeds national benchmarks, driven largely by thefts from vehicles and residential burglaries. The city’s proximity to the New York City metro area contributes to transient criminal activity, but local conditions—including a district attorney’s office that has adopted progressive charging and bail policies—are a primary driver. Critics argue that these policies, which emphasize diversion programs and reduced pretrial detention, result in repeat offenders cycling quickly back onto the streets, eroding deterrence and increasing victimization rates.
What residents experience
Daily life for New Haven residents involves heightened vigilance, particularly in neighborhoods outside the Yale campus bubble. Car break-ins and package thefts are routine occurrences, and armed robberies—often involving juveniles—occur in commercial corridors and residential blocks alike. The city’s progressive judiciary has drawn sharp criticism for lenient sentencing in gun-possession and assault cases, a pattern that community safety advocates link to a persistent sense of impunity among offenders. For victims, the experience of reporting crime can be frustrating, as overburdened police and a court system focused on alternatives to incarceration often produce minimal consequences for property crimes and lower-level violent offenses.
Neighborhood-level variation is stark. The East Rock, Wooster Square, and downtown areas near Yale enjoy lower crime rates due to heavy private security presence and university policing. In contrast, neighborhoods such as Fair Haven, Newhallville, and the Hill experience violent crime rates two to three times the city average, with shootings and drug-related violence concentrated in these areas. Residents in these communities bear the brunt of the city’s justice policies, facing higher risks of victimization while seeing fewer arrests and shorter sentences for offenders. Anyone considering a move to New Haven should research block-by-block conditions and understand that the city’s overall statistics mask deep disparities in safety from one street to the next.
* Values derived from national, state, county, city and local statistics and may differ in a specific area. Last updated: 2026-04-30T05:54:41.000Z
Narrative content on this page is AI-generated and may contain mistakes. Verify any details that matter before acting on them.
ReloMaps may earn a commission from affiliate links at no extra cost to you.