Photo: Wikipedia
Demographics of New Martinsville, WV
Affluence Level in New Martinsville, WV
A below-average socioeconomic profile. Incomes, home values, and educational attainment trail the U.S., with higher poverty and unemployment.
People of New Martinsville, WV
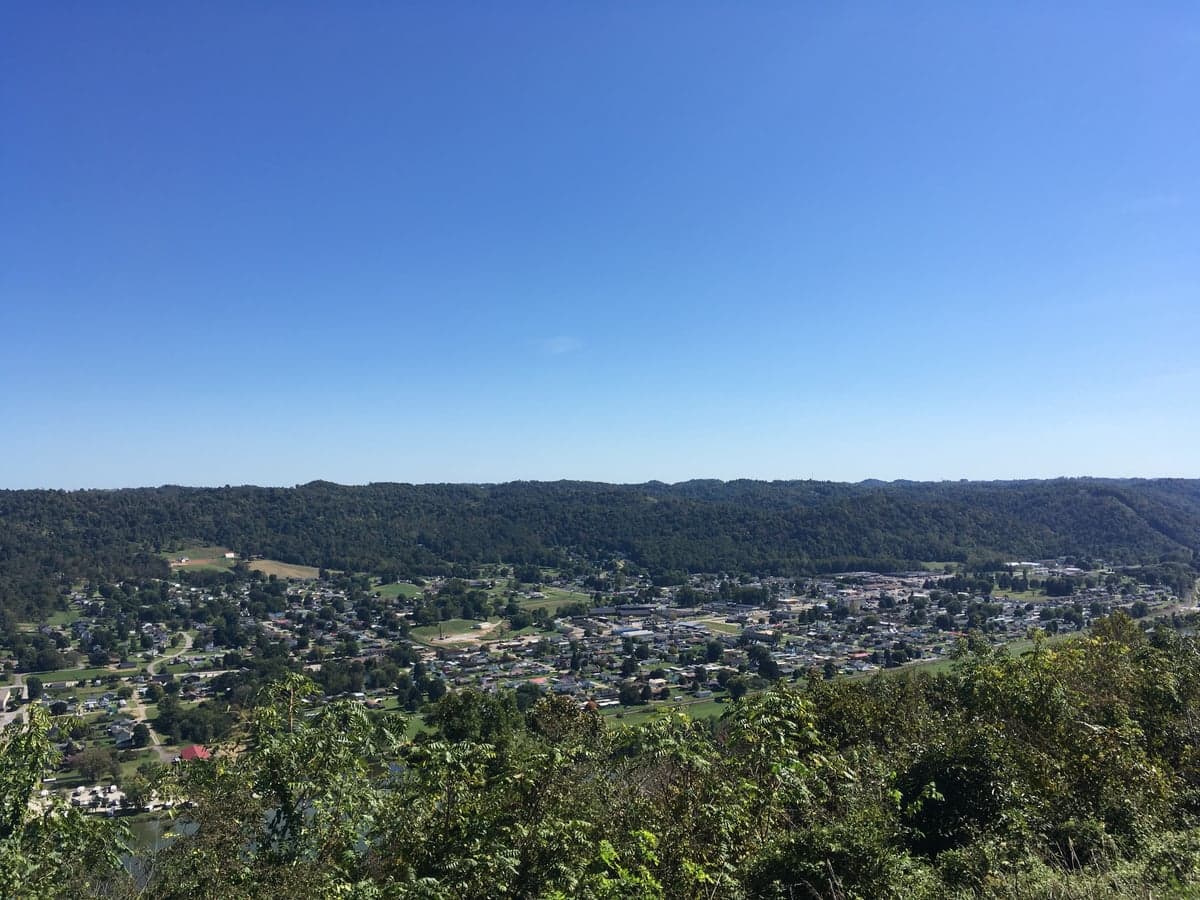
The people of New Martinsville, West Virginia, today form a small, overwhelmingly white community of 5,175 residents, characterized by deep local roots and a notably low foreign-born population of just 0.8%. The city’s identity is shaped by its historic role as a glass-manufacturing and river town, with a population density that feels both tight-knit and insular. With 96.4% of residents identifying as white and only 16.9% holding a college degree, New Martinsville is a place where generational continuity and blue-collar heritage remain the dominant cultural markers, distinct from the more transient or diverse populations found in larger Ohio Valley cities.
How the city was settled and grew
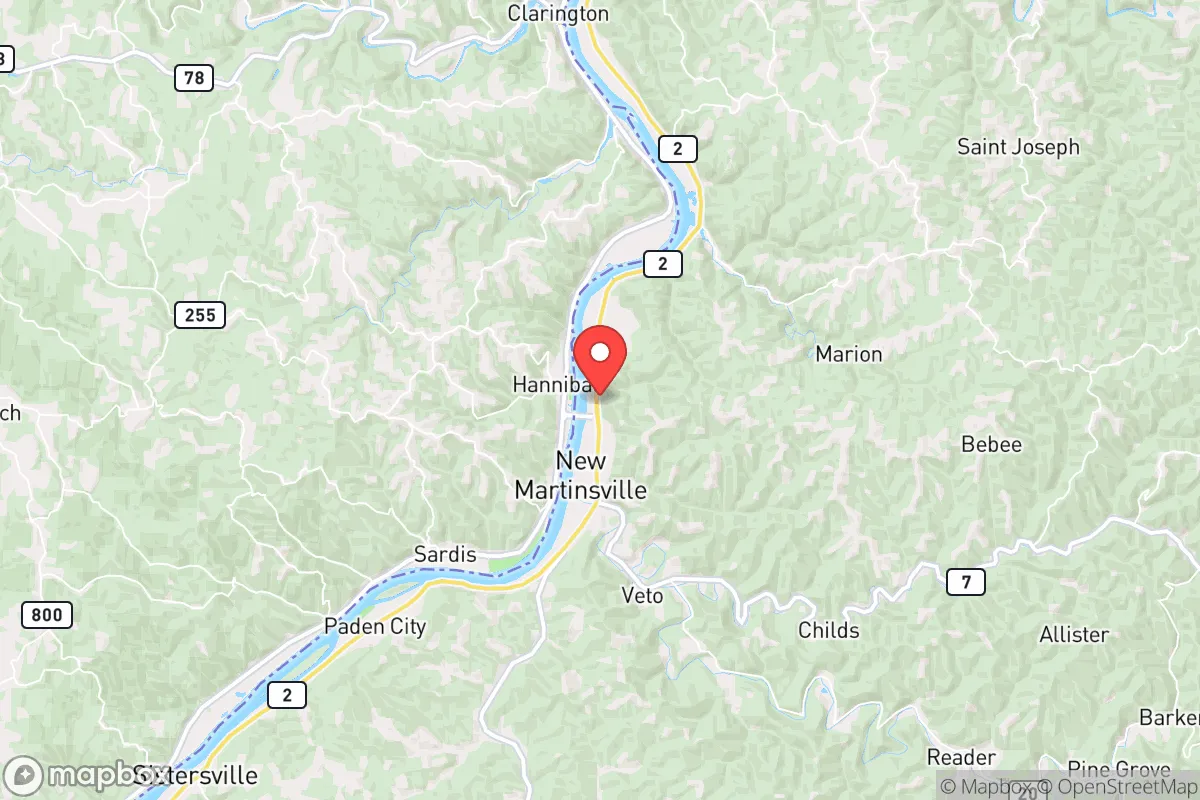
New Martinsville’s population history begins with European-American settlement in the late 18th century, when the area was part of the Virginia frontier. The town was formally laid out in 1835 on a tract of land along the Ohio River, named for Presley Martin, an early landowner. The original settlers were primarily of English, Scots-Irish, and German stock, drawn by fertile bottomlands and the promise of river commerce. The real population surge came after the Civil War, driven by the discovery of natural gas and the rise of glass manufacturing. By the 1880s, companies like the Hazel-Atlas Glass Company and later the Fostoria Glass Company established massive plants, attracting waves of skilled European immigrants—especially German and Italian glassblowers and laborers. These workers settled in what became known as the Flats, the low-lying neighborhoods near the river and factories, where company housing and boarding houses clustered. A second distinct area, North End, grew along the northern ridge as a more middle-class district for foremen and local merchants. By 1900, the population had swelled past 3,000, and the town’s character as a working-class, ethnically European enclave was firmly set. The glass industry remained the economic anchor through the mid-20th century, with the South Side neighborhood absorbing later waves of Appalachian migrants from surrounding rural counties during the 1940s and 1950s, seeking steady factory wages.
Modern era (post-1965)
After the 1965 Hart-Cellar Act, New Martinsville saw virtually no new immigration from outside Europe or North America—a pattern that continues today. The foreign-born share has never risen above 1%, and the city’s racial composition has remained static. The post-1965 era was instead defined by domestic out-migration and suburbanization within the city limits. As the glass industry declined in the 1970s and 1980s—Fostoria Glass closed in 1986—younger residents began leaving for larger job markets, and the population dropped from a peak of roughly 6,500 in 1960 to 5,175 today. The neighborhoods that absorbed the few non-white residents who did arrive—mostly Black families moving from other parts of West Virginia—were concentrated in the West End, a modest area near the river that had historically housed lower-income workers. The Hilltop district, developed in the 1970s and 1980s on the eastern bluffs, became the preferred location for the remaining professional class—doctors, lawyers, and small business owners—while the older North End and South Side neighborhoods saw gradual aging and population thinning. Today, the city’s 1.1% Black population and 0.6% Hispanic population are scattered but slightly more visible in the West End and Flats, while the Asian population (0.3%) and Indian subcontinent population (0.0%) are statistically negligible. The college-educated share of 16.9% reflects the limited local demand for advanced degrees; most residents with bachelor’s degrees work in healthcare, education, or county government.
The future
The population of New Martinsville is heading toward continued slow decline and homogenization. The city’s age profile is older than the state average, and natural decrease (more deaths than births) is the norm. Without significant new immigration or a major economic catalyst, the demographic trajectory is one of gradual shrinkage and aging. The foreign-born share is unlikely to rise meaningfully, as the city lacks the job diversity or housing stock to attract newcomers from abroad. The small Black and Hispanic populations are plateauing rather than growing, and there is no evidence of emerging ethnic enclaves. The next 10–20 years will likely see the North End and Hilltop retain their status as the most stable, owner-occupied neighborhoods, while the Flats and West End may experience further population loss and housing vacancy. The city is not tribalizing into distinct ethnic quarters; rather, it is becoming more uniformly white and older, with a shrinking tax base.
For someone moving in now, New Martinsville offers a quiet, low-cost, and socially predictable environment where neighbors are likely to have known each other for decades. The trade-off is limited economic opportunity, minimal racial or cultural diversity, and a population that is contracting rather than growing. It is a place best suited for those seeking stability and a slower pace, not for those looking for demographic change or a dynamic job market.
* Values derived from national, state, county, city and local statistics and may differ in a specific area. Last updated: 2026-04-21T09:25:29.000Z
Narrative content on this page is AI-generated and may contain mistakes. Verify any details that matter before acting on them.
ReloMaps may earn a commission from affiliate links at no extra cost to you.