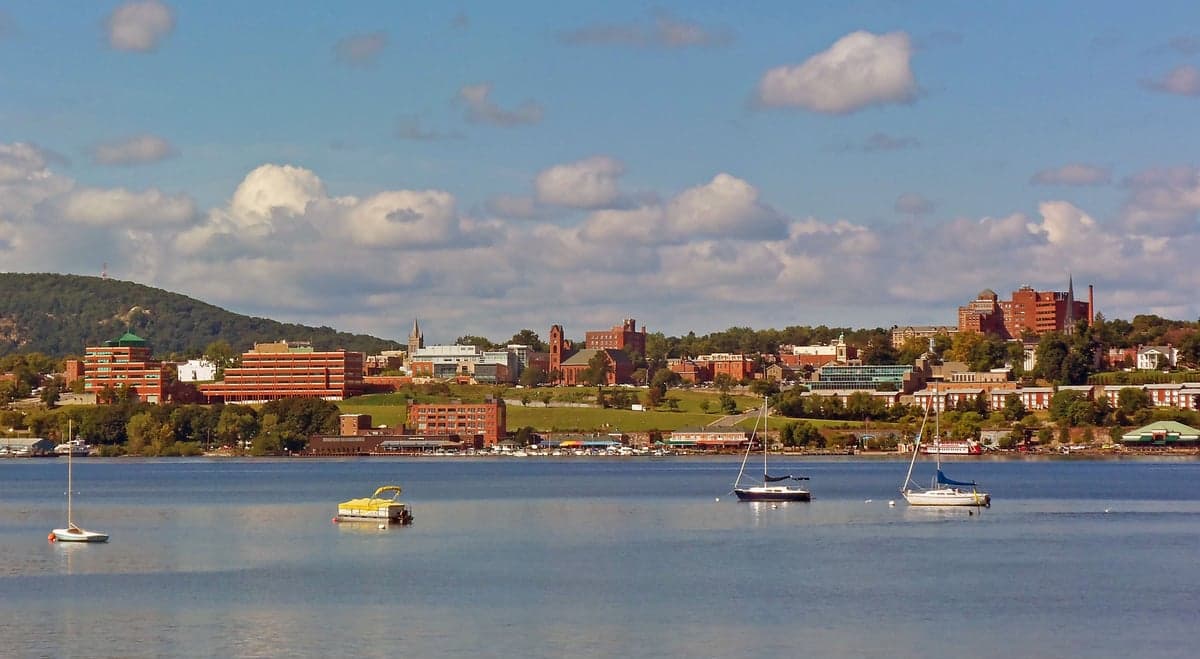
Photo: Wikipedia
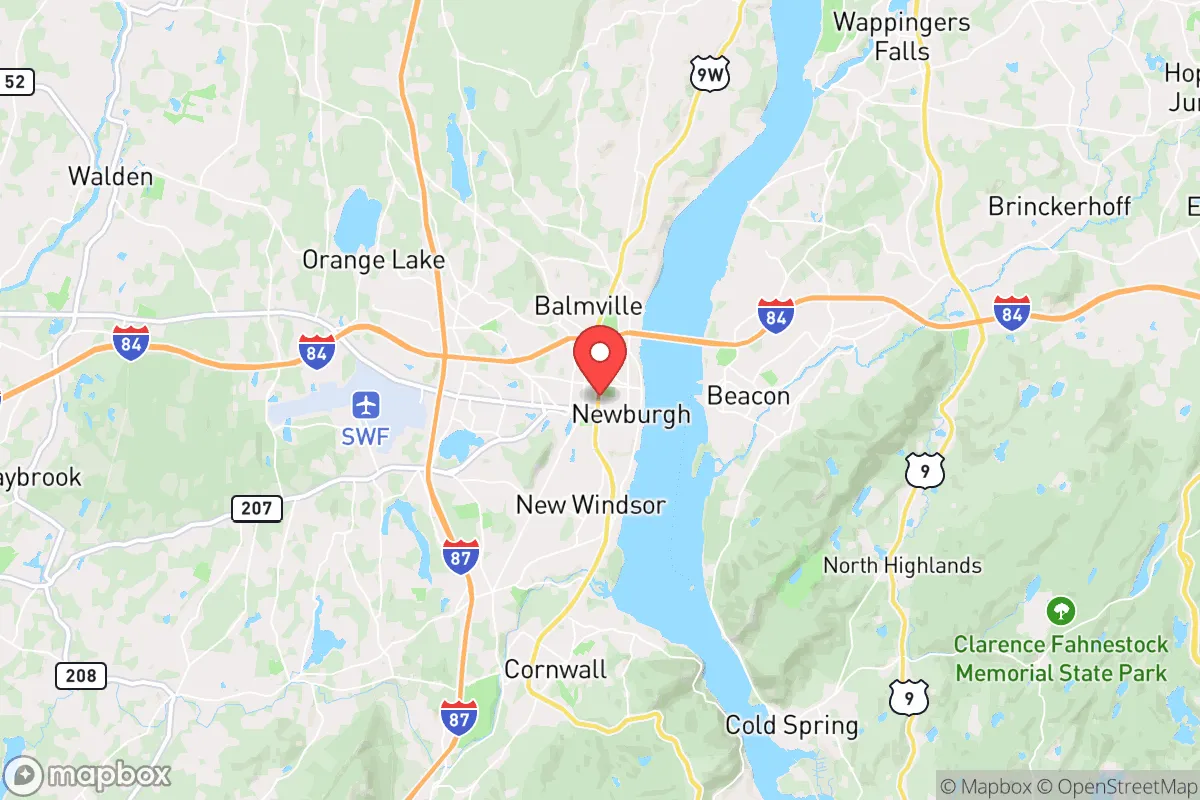
Demographics of Newburgh, NY
Affluence Level in Newburgh, NY
A below-average socioeconomic profile. Incomes, home values, and educational attainment trail the U.S., with higher poverty and unemployment.
People of Newburgh, NY
The people of Newburgh, NY today form a dense, majority-Hispanic urban core of 28,649 residents, with a distinctive identity shaped by decades of demographic turnover and economic struggle. The city is one of the most ethnically diverse in the Hudson Valley, yet also one of the poorest, with a median household income roughly half the national average and a college attainment rate of just 17.8%. Its population is 50.9% Hispanic, 23.8% Black, and 21.7% White, with a small but growing foreign-born share of 13.3% — a mix that gives Newburgh a character far more urban and working-class than its surrounding Orange County suburbs.
How the city was settled and grew
Newburgh’s original population was built by Dutch and English colonists in the early 1700s, drawn by the deep-water harbor on the Hudson River and the fertile valley. The city boomed in the 19th century as a manufacturing and transportation hub — first with whaling and shipping, then with textile mills, brickmaking, and the arrival of the Erie Railroad in the 1850s. The first major immigrant wave was Irish and German laborers, who settled in the East End near the waterfront and built St. Mary’s Church (1848), one of the oldest Catholic parishes in the region. By the 1880s, Italian and Eastern European Jewish immigrants followed, clustering in the South Street corridor and the Broadway commercial district, where they opened small shops and worked in the mills. The city peaked at around 31,000 residents in the 1920s, a dense, walkable industrial town with a strong unionized workforce and a thriving downtown.
Modern era (post-1965)
The post-1965 period brought the most dramatic population shifts. The Hart-Cellar Act opened immigration from Latin America and the Caribbean, while the collapse of Newburgh’s manufacturing base — the last major factory, the Schrade knife plant, closed in 2004 — triggered white flight to suburbs like the Town of Newburgh and Beacon. Puerto Rican migrants began arriving in the 1970s, followed by Dominicans and Mexicans in the 1990s and 2000s. These groups concentrated in the West End (west of Broadway) and the Washington Heights neighborhood, where Hispanic-owned bodegas, churches, and community centers now dominate the streetscape. Black residents, many from the South during the Great Migration and later from New York City, settled in the South Side around South Street and the Dixie Avenue corridor. The White population collapsed from over 80% in 1970 to just 21.7% today, while the Hispanic share rose from near zero to a majority. The foreign-born share (13.3%) is lower than in many gateway cities, but the city’s poverty rate (roughly 30%) and low college attainment reflect the economic dislocation of these transitions.
The future
Newburgh’s population is likely to continue its Hispanic majority trend, driven by ongoing immigration from Mexico and Central America and higher birth rates among Hispanic families. The Black population has stabilized at around 24%, while the White share is expected to shrink further as older, non-Hispanic White residents age out and are not replaced. The city is not homogenizing into a single enclave but rather tribalizing into distinct ethnic neighborhoods: the West End is overwhelmingly Hispanic, the South Side remains predominantly Black, and the East End near the waterfront is seeing a small influx of higher-income White and Asian newcomers drawn to new condos and the revived waterfront park — though this gentrification is limited and contested. The East/Southeast Asian population (0.5%) and Indian population (0.1%) are negligible and unlikely to grow significantly without a major employer or university anchor. The next 10-20 years will likely see Newburgh remain a poor, majority-Hispanic city with a stable Black minority, a shrinking White remnant, and a small but visible gentrifying fringe along the river.
For someone moving in now, Newburgh is a city of stark contrasts: a historic downtown with beautiful 19th-century architecture, a waterfront park with Manhattan views, and a deeply rooted Hispanic and Black community — but also high crime, failing schools, and a tax base too weak to fund basic services. It is not a place of upward mobility for most residents, but it offers affordable housing and a strong sense of neighborhood identity for those who value urban grit over suburban safety. The demographic trajectory points toward a more Hispanic, poorer, and younger city — a reality that conservative-leaning movers should weigh carefully against the area’s low home prices and proximity to New York City.
* Values derived from national, state, county, city and local statistics and may differ in a specific area. Last updated: 2026-05-01T05:31:15.000Z
Narrative content on this page is AI-generated and may contain mistakes. Verify any details that matter before acting on them.
ReloMaps may earn a commission from affiliate links at no extra cost to you.