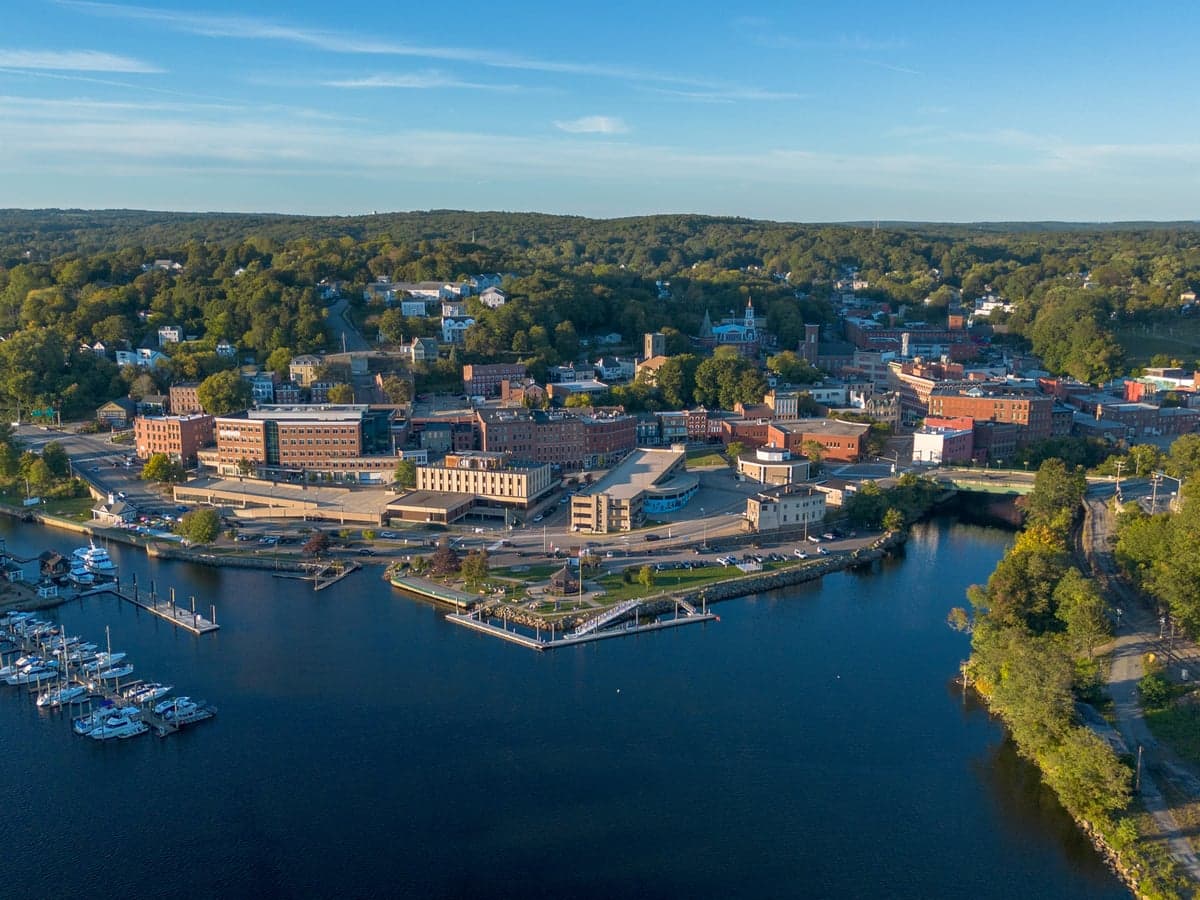
Photo: Wikipedia
Demographics of Norwich, CT
Affluence Level in Norwich, CT
A below-average socioeconomic profile. Incomes, home values, and educational attainment trail the U.S., with higher poverty and unemployment.
People of Norwich, CT
The people of Norwich, Connecticut today form a dense, historically layered community of roughly 40,000 residents, marked by a working-class character and a notably diverse racial and ethnic mix for eastern Connecticut. With a population density of about 1,800 people per square mile, Norwich feels more urban than its rural surroundings, yet retains a small-city feel centered on the historic downtown and the Thames River. Distinctive identity markers include a strong sense of neighborhood pride—residents often identify first with their specific district, such as the Norwichtown historic district or the Greeneville section—and a population that is 55.9% white, 21.4% Hispanic, 10.1% Black, and 5.9% East/Southeast Asian, with a foreign-born share of 6.5% that is notably lower than the state average.
How the city was settled and grew
Norwich was founded in 1659 by English Puritan settlers from the Massachusetts Bay Colony, who purchased land from the Mohegan tribe and established the town around the Norwichtown green. The original population was almost entirely English, drawn by fertile river valleys and the promise of self-governance under a town-meeting system. The city’s growth exploded in the early 19th century when the Norwich and Worcester Railroad arrived, making Norwich a manufacturing hub for textiles, firearms, and paper. This industrial boom drew successive waves of immigrants: Irish laborers in the 1840s and 1850s settled in the Greeneville neighborhood, building St. Mary’s Church and forming the city’s first large Catholic community. French-Canadian mill workers arrived from Quebec after 1860, concentrating in the Occum and Taftville districts, where they worked at the massive Ponemah Mills and built tight-knit parishes like St. Joseph’s. Polish and Italian immigrants followed in the 1890s–1910s, settling in the Norwichtown and Downtown areas, establishing small businesses and fraternal organizations. By 1920, Norwich was a majority-immigrant city, with over 40% of its population foreign-born, overwhelmingly from Europe.
Modern era (post-1965)
The post-1965 era reshaped Norwich’s population dramatically. The 1965 Hart-Celler Act opened immigration from Asia and Latin America, and the decline of manufacturing after 1970 pushed many white ethnic families to the suburbs of nearby Montville and Preston. Into this vacuum came new groups: Puerto Rican and Dominican families began arriving in the 1970s and 1980s, settling in the Downtown and Greenville neighborhoods, where housing was affordable and rental stock plentiful. By 2020, the Hispanic share had grown to 21.4%, making Norwich one of the most Hispanic cities in eastern Connecticut. East/Southeast Asian communities—primarily Vietnamese and Chinese—arrived in smaller numbers during the 1980s and 1990s, many as refugees or secondary migrants from larger cities, and concentrated in the Norwichtown area near the Norwich Free Academy and along West Main Street. The Black population, which had been small and historically concentrated in the Downtown and Occum sections, grew to 10.1% by 2020, driven by domestic migration from New York and Hartford. The Indian-subcontinent population remains tiny at 0.5%, with no distinct enclave. The college-educated share is just 22.6%, well below the state average of 40%, reflecting the city’s blue-collar base and the departure of many degree-holders to larger job markets.
The future
The population of Norwich is likely to continue its gradual diversification, but the pace of change is slowing. The Hispanic share is still growing, driven by natural increase and continued migration from Puerto Rico and Central America, but the foreign-born share (6.5%) is low and not rising quickly, suggesting that future growth will come more from births than from new arrivals. The white population, now 55.9%, is aging and declining slowly as older residents pass away or move to lower-cost rural towns. The East/Southeast Asian community is stable but not expanding, with little new immigration from Vietnam or China to Norwich. The city is not tribalizing into starkly separate enclaves—most neighborhoods are mixed, though Greeneville remains heavily Hispanic and Norwichtown retains a white plurality. The biggest demographic risk is population loss: Norwich peaked at 44,000 in 1960 and has been slowly shrinking, and without a major employer or housing boom, the next 10–20 years will likely see a continued slow decline to around 38,000, with a slightly higher Hispanic share and a slightly lower white share.
For someone moving to Norwich now, the city offers a genuinely diverse, working-class community with deep ethnic roots and affordable housing, but it is not a place of rapid growth or upward mobility. The population is stable, aging, and slowly becoming more Hispanic, while the white and Black shares hold steady. New residents will find a city where neighborhood identity still matters, where the cost of living is low, and where the demographic future looks more like a slow evolution than a dramatic transformation.
* Values derived from national, state, county, city and local statistics and may differ in a specific area. Last updated: 2026-04-19T05:39:21.000Z
Narrative content on this page is AI-generated and may contain mistakes. Verify any details that matter before acting on them.
ReloMaps may earn a commission from affiliate links at no extra cost to you.