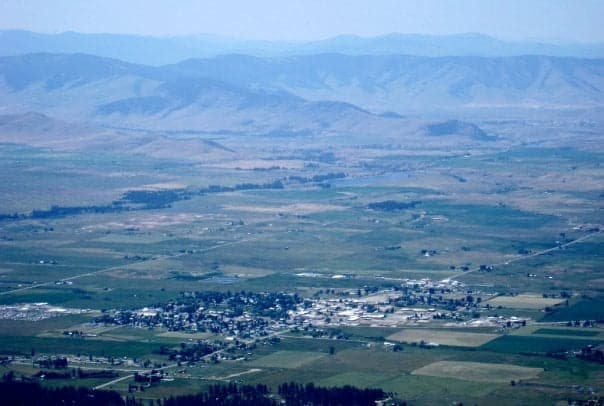
Photo: Wikipedia
Demographics of Ronan, MT
Historical data isn't available for Ronan, MT. Trends shown are for Montana, Montana.
Affluence Level in Ronan, MT
A below-average socioeconomic profile. Incomes, home values, and educational attainment trail the U.S., with higher poverty and unemployment.
People of Ronan, MT
Ronan, Montana, is a small, tight-knit community of 1,962 residents where Native American heritage forms the demographic backbone, with 46.3% of the population identifying as White and a significant plurality being enrolled members of the Confederated Salish and Kootenai Tribes (CSKT). The city sits entirely within the Flathead Indian Reservation, giving it a distinctive identity as a tribal border town where reservation governance, agricultural roots, and a growing Hispanic service sector intersect. With only 0.8% foreign-born residents and a low 15.0% college attainment rate, Ronan remains a working-class, family-oriented place where multi-generational ties to the land and tribe are the norm rather than the exception.
How the city was settled and grew
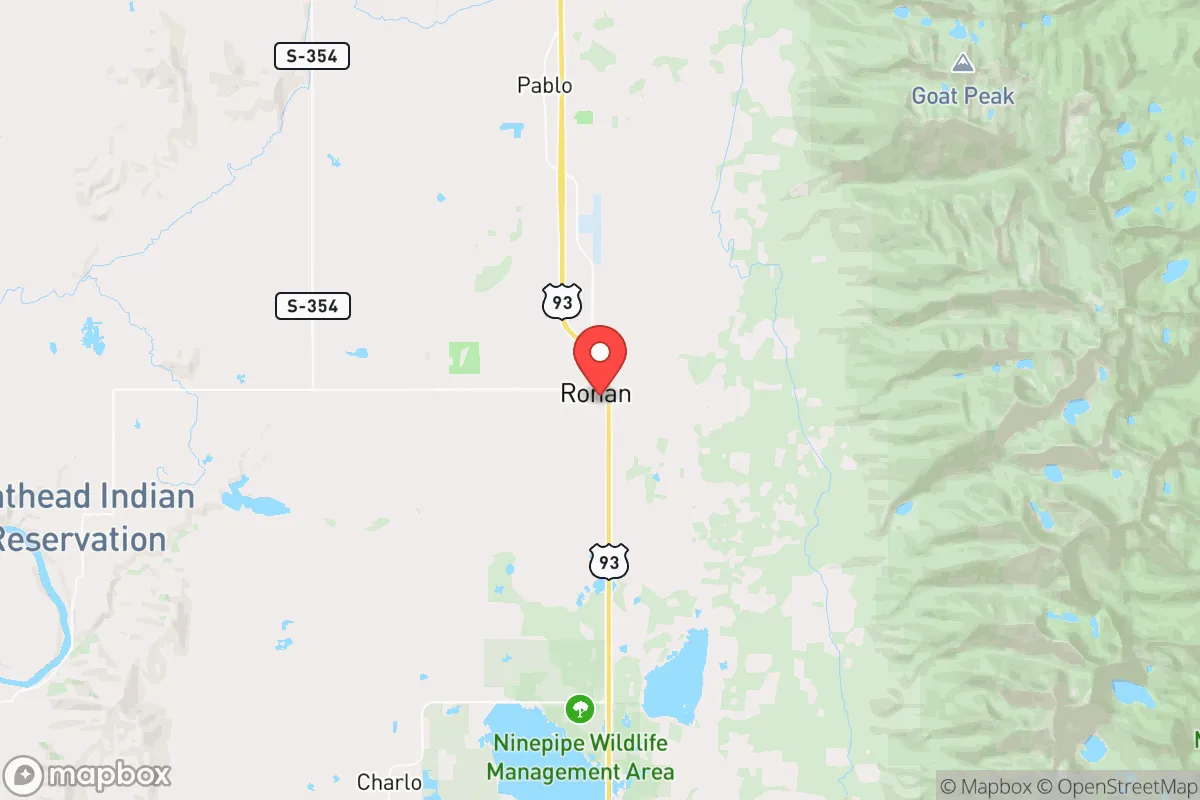
Ronan’s human history begins not with European settlers but with the Salish, Kootenai, and Pend d’Oreille peoples who have inhabited the Flathead Valley for millennia. The modern city was founded in 1883 as a railroad stop on the Northern Pacific line, named after Major Peter Ronan, the U.S. Indian agent who oversaw the nearby Jocko Agency. The original non-Native settlers were primarily homesteaders of German, Irish, and Scandinavian stock drawn by the 1855 Hellgate Treaty, which opened reservation land to white farming after the Dawes Act of 1887 broke up communal tribal holdings. These early farmers built the Original Townsite around Main Street and the railroad depot, a grid of wood-frame houses and grain elevators that still forms the historic core. By 1910, the population had reached roughly 400, with a mix of tribal families living in the Mission District (near the St. Ignatius Mission, four miles south) and white homesteaders concentrated in the North Side along U.S. Highway 93. The arrival of the Flathead Irrigation Project in the 1920s brought a second wave of laborers—mostly Irish and Italian construction workers—who settled in the West End near the irrigation canals, an area now characterized by older ranch-style homes and small farms.
Modern era (post-1965)
The 1965 Hart-Cellar Act had minimal direct effect on Ronan, as the city’s foreign-born population remains negligible at 0.8%. Instead, the major demographic shift after 1965 was internal: the steady return of tribal members to the reservation following the Indian Self-Determination Act of 1975, which gave CSKT greater control over local schools, health care, and law enforcement. This repatriation concentrated in the Pablo-Ronan Corridor, a stretch of Highway 93 where tribal housing developments like Kicking Horse Estates (built in the 1980s) and the Skyline Addition (1990s) absorbed families moving back from urban areas like Seattle and Spokane. Meanwhile, the Hispanic population—now 4.7% of Ronan—began growing in the 1990s as agricultural labor demand increased for the area’s cherry orchards, hay fields, and cattle ranches. These mostly Mexican-American families settled in the South Side near the Ronan Cooperative Brewery and the Bitterroot River bottomlands, where rental duplexes and mobile home parks provide affordable housing for seasonal workers. The East/Southeast Asian community (2.5%) is a newer arrival, primarily Hmong and Vietnamese families who moved from California and Minnesota after 2000 to work in the region’s meatpacking and food-processing plants; they are concentrated in the Ronan Heights subdivision, a small cluster of newer homes east of the high school.
The future
Ronan’s population is slowly homogenizing along tribal lines, with the White share declining (down from roughly 55% in 2000) as the Native American population grows through higher birth rates and continued return migration. The Hispanic community is plateauing rather than expanding, as agricultural mechanization reduces demand for seasonal labor, and many second-generation families are assimilating into the broader working-class culture. The East/Southeast Asian enclave in Ronan Heights remains small and stable, with no signs of rapid growth due to the lack of a co-ethnic employer or religious institution to anchor further migration. Over the next 10–20 years, Ronan will likely become more Native American and less White, with the tribal government—already the largest employer through CSKT enterprises like the KwaTaqNuk Resort and S&K Technologies—driving both population growth and economic stability. The city is not tribalizing into distinct enclaves; rather, it is consolidating into a single, reservation-anchored community where tribal identity is the dominant cultural force.
For someone moving in now, Ronan is becoming a place where Native American governance and community life set the tone, with a small but stable Hispanic and Asian presence adding modest diversity. The low college attainment rate and high proportion of tribal members mean that social networks are deeply local and family-based, and newcomers—especially those without tribal ties—should expect a slower pace of integration. This is a community that values continuity over change, and its demographic future points toward greater cultural cohesion around the CSKT identity, not fragmentation.
* Values derived from national, state, county, city and local statistics and may differ in a specific area. Last updated: 2026-04-21T14:49:03.000Z
Narrative content on this page is AI-generated and may contain mistakes. Verify any details that matter before acting on them.
ReloMaps may earn a commission from affiliate links at no extra cost to you.