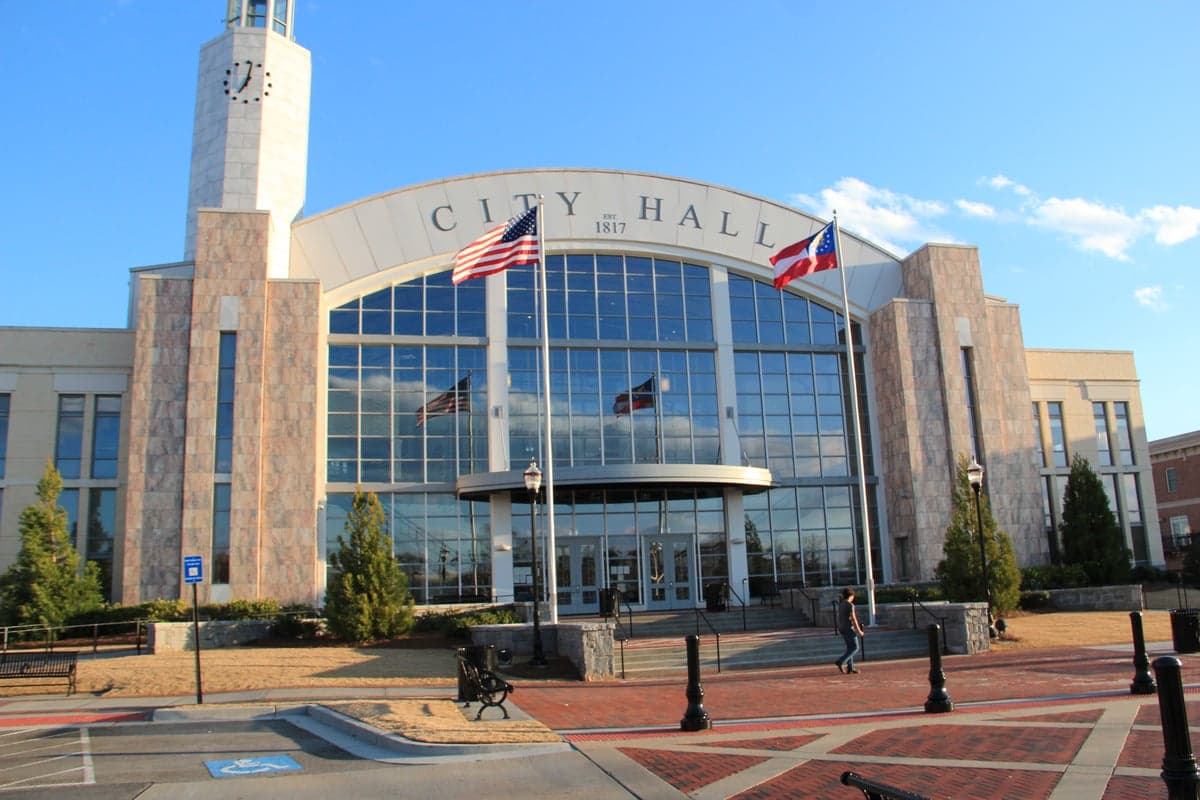
Photo: Wikipedia
Demographics of Suwanee, GA
Affluence Level in Suwanee, GA
An upper-middle-class area. Household wealth, education levels, and homeownership run ahead of national benchmarks.
People of Suwanee, GA
The people of Suwanee, Georgia today number 21,811, forming a highly educated, family-oriented suburb where no single ethnic group holds a majority. With 61.0% of adults holding a college degree, the city is a magnet for professionals, particularly in technology and healthcare, drawn by top-rated schools and a strong sense of community. The population is notably diverse: 50.6% White, 19.8% East/Southeast Asian, 11.8% Black, 7.5% Indian (subcontinent), and 6.1% Hispanic, with 11.6% foreign-born. This demographic profile reflects a place that has transformed from a quiet railroad depot into a sought-after destination for families seeking safety, space, and opportunity.
How the city was settled and grew
Suwanee’s human history begins not with colonial settlement but with the railroad. Founded in the 1870s as a stop on the Richmond and Danville Railroad (later the Southern Railway), the area was originally a sparsely populated farming community. The first residents were predominantly white farmers of Scots-Irish and English descent, who cleared land for cotton and corn. The historic Old Town Suwanee district, centered around Main Street and the railroad tracks, was the original nucleus—a collection of general stores, a depot, and modest homes built by these early families. Through the early 20th century, the population remained small and homogeneous, with growth tied to agriculture and the railroad. A second wave arrived during the post-World War II era, as returning veterans and their families sought affordable land in Gwinnett County. These new residents built modest ranch homes in areas like Suwanee Station and along Lawrenceville-Suwanee Road, forming the foundation of the city’s mid-century identity as a quiet, white, working-class suburb.
Modern era (post-1965)
The 1965 Hart-Cellar Act and the subsequent expansion of Atlanta’s economy reshaped Suwanee’s population dramatically. The city’s modern transformation began in earnest in the 1990s and accelerated through the 2000s, driven by the construction of the Georgia 400 and I-85 corridors, which made Suwanee a commuter-friendly suburb for Atlanta’s booming tech and corporate sectors. The first major non-white group to arrive in significant numbers was East/Southeast Asian families, particularly of Chinese, Korean, and Vietnamese ancestry, who were drawn by the highly ranked Gwinnett County public schools and the availability of newer, larger homes. These families concentrated in master-planned subdivisions like Riverbrooke and Olde Towne at Suwanee, where they now represent a substantial share of residents. A second wave of Indian (subcontinent) families followed in the 2000s and 2010s, settling heavily in neighborhoods such as Brogdon Park and Suwanee Glen, drawn by the same school reputation and the presence of Indian-owned businesses and cultural organizations in the broader Gwinnett area. Black and Hispanic populations grew more gradually, with Black families often choosing established subdivisions like White Oak Hills and Hispanic families settling in older, more affordable housing stock near the Buford Highway corridor. The result is a city where ethnic groups are not rigidly segregated but do cluster in distinct neighborhoods, with East/Southeast Asian and Indian families disproportionately represented in newer, higher-priced subdivisions, while White and Black residents are more evenly distributed across both older and newer areas.
The future
Suwanee’s population is trending toward continued diversification and educational attainment, but not toward homogenization. The East/Southeast Asian and Indian communities are both growing and assimilating, with second-generation children attending college at high rates and entering professional fields. The White population share has declined steadily since 2000, while the Hispanic and Black shares have held relatively stable. The city’s foreign-born population (11.6%) is likely to plateau rather than surge, as housing prices have risen sharply—the median home value now exceeds $500,000—limiting new immigration from lower-income groups. The next 10-20 years will likely see Suwanee become a majority-minority city, with East/Southeast Asian and Indian residents together forming a plurality. The city is not tribalizing into isolated enclaves; rather, neighborhoods like Riverbrooke and Olde Towne are becoming more mixed as older white residents age in place and younger families of all backgrounds move in. The primary demographic pressure point will be affordability, as the city’s desirability continues to attract high-income professionals, potentially pricing out the working-class families who formed its earlier waves.
For someone moving in now, Suwanee is becoming a highly educated, majority-minority suburb where diversity is lived rather than merely statistical. The city’s identity is no longer tied to its railroad past but to its schools, its parks, and its reputation as a safe, family-oriented community. The population is stable, prosperous, and increasingly Asian and Indian in character, with a strong civic culture that has so far avoided the political polarization seen in other Atlanta suburbs. It is a place where a new resident can expect neighbors from many backgrounds, all sharing a common focus on education, property values, and community life.
* Values derived from national, state, county, city and local statistics and may differ in a specific area. Last updated: 2026-04-23T05:29:02.000Z
Narrative content on this page is AI-generated and may contain mistakes. Verify any details that matter before acting on them.
ReloMaps may earn a commission from affiliate links at no extra cost to you.