Photo: Wikipedia
Demographics of Thurmont, MD
Affluence Level in Thurmont, MD
A middle-class area roughly in line with national averages across income, home values, education, and employment.
People of Thurmont, MD
Thurmont, Maryland, is a small, predominantly white community of 6,439 residents, characterized by a strong sense of local heritage and a notably low foreign-born population of just 0.9%. The town’s identity is rooted in its rural Frederick County setting, with a population that is 88.4% white and a Hispanic share of 5.0%, reflecting limited recent immigration. With a college-educated rate of 25.8%, Thurmont leans toward a working- and middle-class demographic, where family ties and local employment in manufacturing, agriculture, and government services shape daily life. The population is stable but aging, with little racial or ethnic diversification on the horizon.
How the city was settled and grew
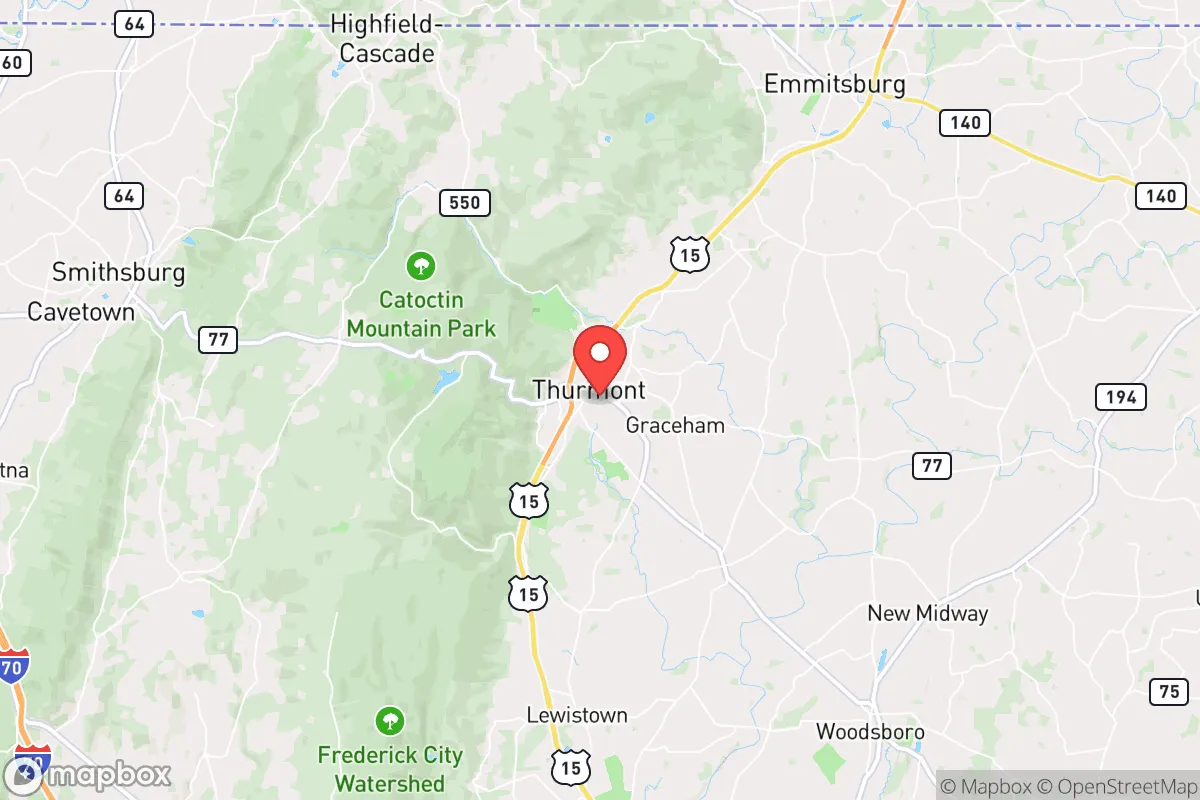
Thurmont’s human history begins with German and Scots-Irish settlers who arrived in the mid-18th century, drawn by land grants in the fertile Catoctin Valley. The town was originally known as Mechanicstown, a name reflecting its early industrial base of mills and blacksmith shops that served surrounding farms. The arrival of the Western Maryland Railroad in the 1870s spurred growth, transforming Thurmont into a market town for agricultural goods and timber. The historic East End neighborhood, centered along East Main Street, was built by these early German and Scots-Irish families, who erected stone and brick homes that still stand today. A second wave of growth came in the early 20th century with the establishment of the Catoctin Mountain Park and Camp David, which brought federal employees and service workers. These newcomers settled in the West End district, near the railroad depot and along Water Street, creating a more diverse working-class enclave. By 1950, Thurmont’s population was nearly entirely white, with a small number of African American families living in the Harbaugh Valley area, a rural fringe where they worked as farm laborers and domestic servants.
Modern era (post-1965)
After the 1965 Hart-Cellar Act, Thurmont saw virtually no immigration-driven diversification. The foreign-born share remains under 1%, and the town’s racial composition has shifted only modestly. The Hispanic population grew from negligible levels in 1990 to 5.0% by 2020, driven by domestic in-migration of families from other parts of Maryland and the Mid-Atlantic, not by international migration. These Hispanic residents have concentrated in the North Thurmont area, near the intersection of Route 15 and Frederick Road, where newer, more affordable housing developments like the Mountain View Estates subdivision were built in the 1990s and 2000s. The Black population remains small at 1.7%, with most families living in the South Street corridor, a historically mixed-income area near the town’s industrial park. East/Southeast Asian and Indian subcontinent populations are effectively zero, reflecting Thurmont’s lack of high-skilled job sectors that attract these groups. Suburbanization from the Washington, D.C., and Baltimore metros has brought some white-collar commuters, who have settled in the Huntersfield neighborhood, a newer subdivision of single-family homes built in the 2000s. However, these newcomers are overwhelmingly white and native-born, reinforcing the town’s demographic stability.
The future
Thurmont’s population is likely to remain overwhelmingly white and native-born for the next 10–20 years. The town is not homogenizing or tribalizing into distinct ethnic enclaves; rather, it is experiencing slow, steady aging, with a median age of 44.2 years as of 2020. The Hispanic share may inch upward to 7–8% by 2040, driven by natural increase and continued domestic migration from nearby counties, but this growth will be gradual and concentrated in the North Thurmont area. The foreign-born population is unlikely to rise significantly, as Thurmont lacks the rental housing stock, public transit, and entry-level job base that attract immigrants. The college-educated share, at 25.8%, is below the national average and may decline slightly as younger residents leave for larger cities. The East End and West End historic districts will continue to house long-term white families, while newer subdivisions like Mountain View Estates will absorb most new residents, who will be predominantly white and native-born. No significant Asian, Indian, or Black population growth is expected, given the absence of economic pull factors.
Thurmont is becoming a quieter, older, and slightly more Hispanic version of its current self—a stable, low-diversity community where change comes slowly. For someone moving in now, this means a predictable social environment with strong local institutions, but limited exposure to cultural or ethnic variety. The town’s future is one of continuity, not transformation, making it a fit for those seeking a traditional, small-town Maryland lifestyle.
* Values derived from national, state, county, city and local statistics and may differ in a specific area. Last updated: 2026-04-22T02:34:52.000Z
Narrative content on this page is AI-generated and may contain mistakes. Verify any details that matter before acting on them.
ReloMaps may earn a commission from affiliate links at no extra cost to you.