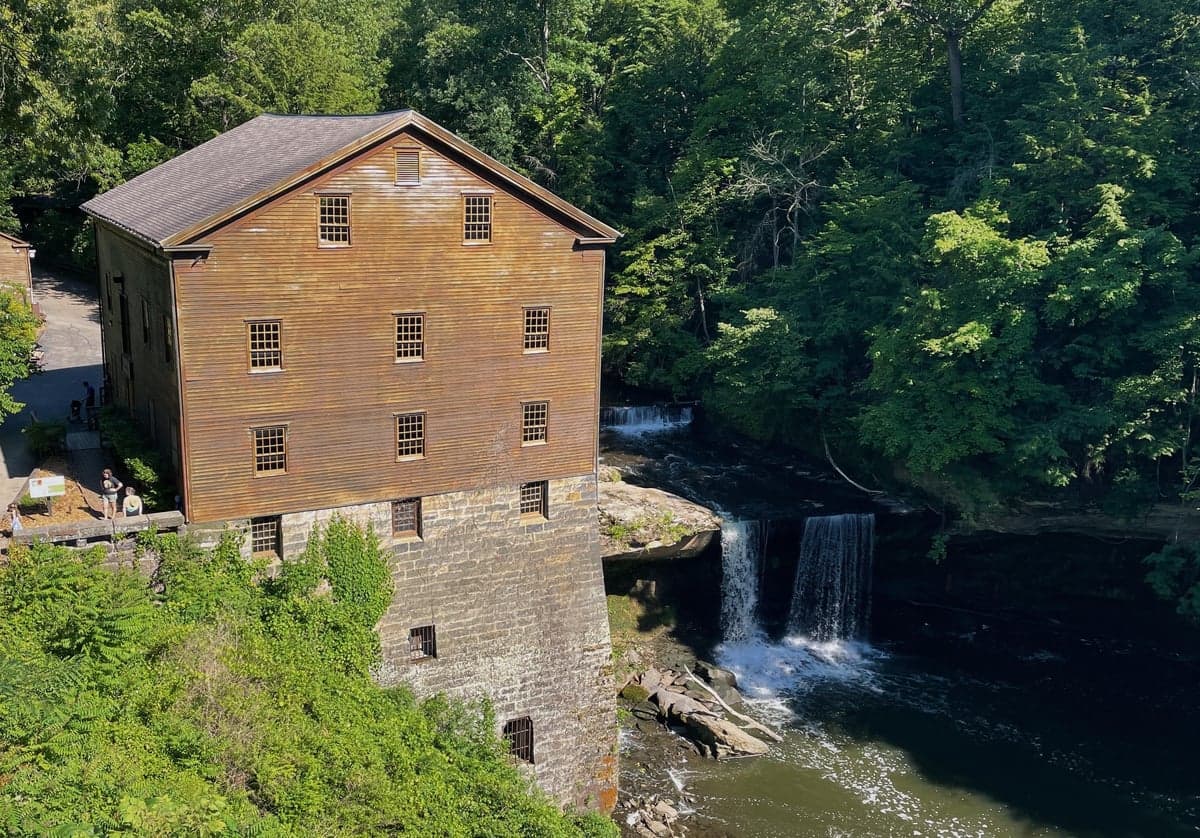
Photo: Wikipedia
Demographics of Youngstown, OH
Affluence Level in Youngstown, OH
A low-income area with significant economic hardship. Household wealth and educational attainment are well below national averages.
People of Youngstown, OH
Youngstown, Ohio, is today a city of roughly 59,605 residents defined by its industrial past and a starkly divided racial landscape: 41.2% white, 40.5% Black, and 11.2% Hispanic, with a foreign-born population of just 1.7%. The city is among the most segregated in the Midwest, with distinct neighborhoods still reflecting the ethnic and racial waves that built and then reshaped it. Its population has fallen by more than half since its 1930 peak of 170,000, leaving a community that is older, poorer, and less educated than the national average — only 15.2% of adults hold a bachelor’s degree. For a conservative-leaning newcomer, Youngstown offers a tight-knit, blue-collar identity but also a shrinking tax base and limited economic dynamism.
How the city was settled and grew
Youngstown’s population story begins with the Mahoning River valley’s iron and coal deposits. The city was founded in 1796 by John Young, a surveyor from New York, but its explosive growth came after the Civil War when the iron industry gave way to steel. The first major wave of immigrants were Irish and German laborers who built the canals and railroads in the 1840s–1860s, settling in the Brier Hill neighborhood, which became a tight-knit Irish enclave. By the 1880s, the steel mills demanded more hands, drawing Eastern and Southern Europeans — Italians, Poles, Slovaks, and Hungarians — who formed dense ethnic neighborhoods. Smoky Hollow (the lower South Side) became the Italian heartland, while the West Side around Glenwood Avenue filled with Polish and Slovak families. These groups built the city’s Catholic parish network and union halls, creating a solidly Democratic, working-class culture that persisted for generations. The Black population grew slowly during the Great Migration, rising from 1.5% in 1910 to about 14% by 1950, concentrated in the South Side near the mills.
Modern era (post-1965)
The post-1965 era brought two transformative shifts: the collapse of steel and the acceleration of white flight. Between 1970 and 2000, Youngstown lost over 60% of its white population as deindustrialization eliminated 40,000 manufacturing jobs. The North Side and West Side, once solidly white ethnic, rapidly aged and emptied, with many families moving to suburban Canfield, Boardman, and Poland. Meanwhile, the Black population, which had been confined to the South Side and parts of the East Side, expanded into vacated neighborhoods. By 2020, the city was nearly evenly split between white and Black residents. The Hispanic population, now 11.2%, grew from near-zero in 1980, driven by Puerto Rican and Mexican families settling in the South Side and Brier Hill areas, often in housing left behind by departing whites. The Asian population remains tiny (0.3% East/Southeast Asian, 0.3% Indian subcontinent), concentrated in a few blocks near Youngstown State University. The foreign-born share, at 1.7%, is one of the lowest among Ohio cities — the city has not been a significant immigrant destination since the 1920s.
The future
Youngstown’s population is projected to continue shrinking, though at a slower pace than the 2000–2020 period. The city’s 2020–2023 decline was roughly 3%, compared to 8% in the prior decade. The white population is aging rapidly — the median age of white residents is 44, versus 33 for Black and 28 for Hispanic residents — suggesting continued natural decrease. The Black population is plateauing, with little in-migration from outside the region. The Hispanic share is the only segment growing, driven by births and some domestic migration from Texas and Florida, but the growth is modest (roughly +1% per decade). The city is not tribalizing into new enclaves so much as consolidating: the South Side is becoming majority Hispanic, the North Side and West Side remain predominantly white but thinning, and the East Side is majority Black. No significant immigrant communities are emerging to offset losses. The next 10–20 years will likely see Youngstown stabilize around 50,000–55,000 residents, with a rising Hispanic share (perhaps 15–18%) and a continued white/Black parity.
For someone moving in now, Youngstown is a place where the population is no longer in freefall but is not rebounding either. It offers low housing costs and a strong sense of local identity, but the demographic trends point to a smaller, older, and more Hispanic city. The neighborhoods that once defined the city’s ethnic patchwork are fading into a simpler racial geography, and the economic base that drew generations of immigrants is gone. A newcomer should expect a quiet, affordable, and deeply rooted community — but not one that is growing or diversifying in any dramatic way.
* Values derived from national, state, county, city and local statistics and may differ in a specific area. Last updated: 2026-04-21T19:48:35.000Z
Narrative content on this page is AI-generated and may contain mistakes. Verify any details that matter before acting on them.
ReloMaps may earn a commission from affiliate links at no extra cost to you.