Photo: Wikipedia
Demographics of Belleville, IL
Affluence Level in Belleville, IL
A below-average socioeconomic profile. Incomes, home values, and educational attainment trail the U.S., with higher poverty and unemployment.
People of Belleville, IL
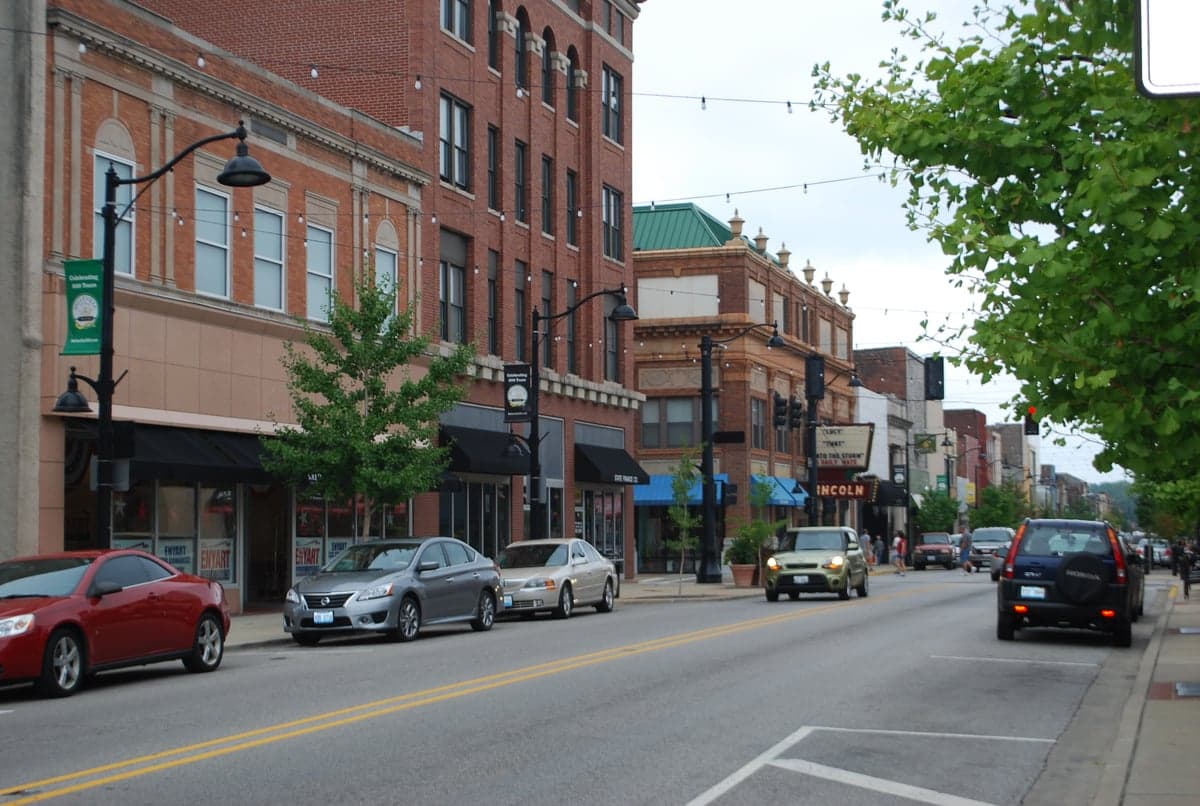
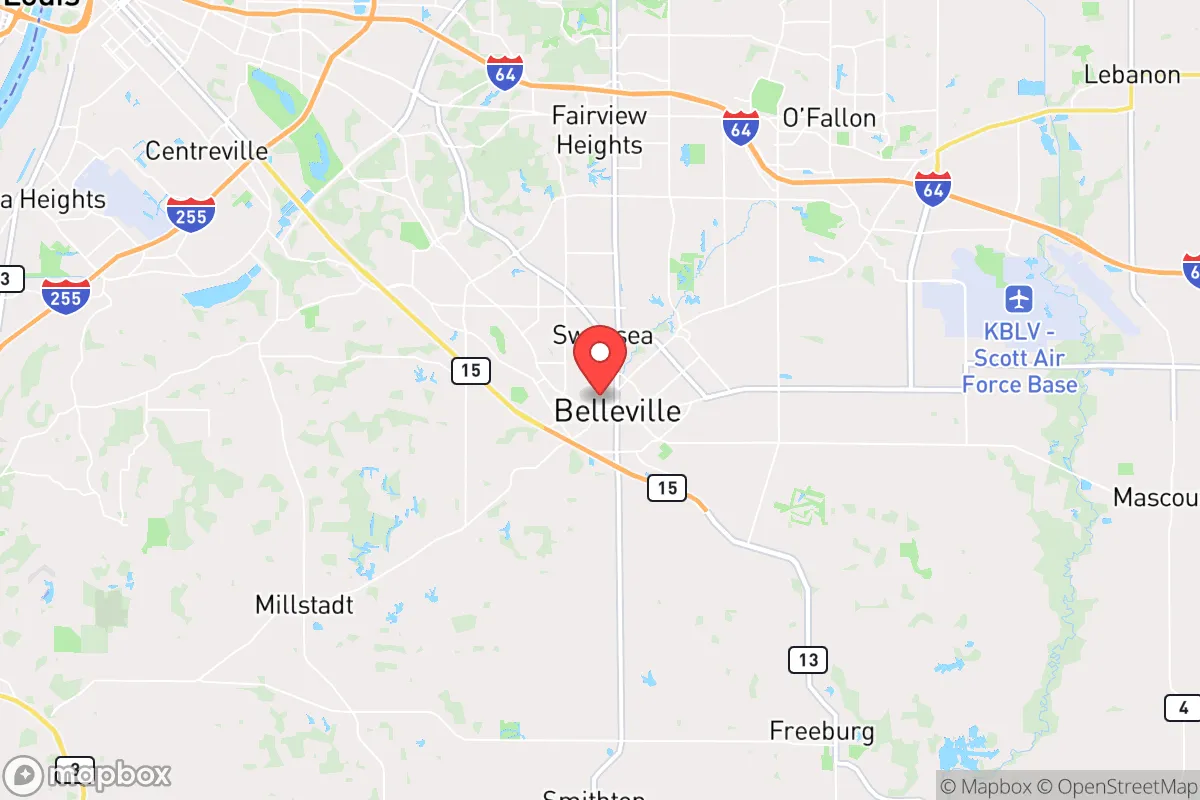
The people of Belleville, Illinois today form a predominantly Black and White city of 41,722 residents, with a notably small foreign-born population of just 1.0% and a college attainment rate of 28.0%. The city’s character is shaped by its historic role as a German Catholic stronghold and its later transformation into a majority-Black urban center within the St. Louis metro area. Distinctive identity markers include a strong sense of local pride tied to its historic downtown, a legacy of union and manufacturing labor, and a population that is more racially polarized than the surrounding St. Clair County. For a conservative-leaning mover, Belleville offers a dense, walkable historic core with a lower cost of living than St. Louis proper, but with demographic and economic trends that warrant close attention.
How the city was settled and grew
Belleville was founded in 1814 by French-speaking settlers from the nearby American Bottom, but its defining population wave arrived with German immigrants in the 1830s through the 1850s. These Germans, many fleeing political unrest and economic hardship, were drawn by the region’s fertile farmland and the promise of work in the emerging coal mining and brewing industries. They built the city’s iconic brick streets and churches, and their descendants concentrated in the Historic West End and German Hill neighborhoods, where many of the original limestone and brick homes still stand. A smaller wave of Irish immigrants arrived in the 1840s and 1850s, settling primarily in the Dutch Hollow area near the railroad yards, working as laborers on the Illinois Central Railroad. By 1900, Belleville was a thriving industrial city with a population of over 17,000, overwhelmingly white and German-American, with a small Black community concentrated in the East End near the stockyards and rail lines. The Great Migration brought a significant Black population from the rural South between 1910 and 1960, drawn by factory jobs at companies like the Belleville Shoe Manufacturing Company and the St. Louis Car Company. These new residents settled in the East End and North Side, creating a distinct Black community that would grow to shape the city’s modern identity.
Modern era (post-1965)
The post-1965 era saw Belleville undergo a dramatic racial and economic transformation. The 1965 Hart-Cellar Act had little direct effect on Belleville’s foreign-born population, which remains negligible at 1.0% today. Instead, the major shift was domestic: white flight to surrounding suburbs like O’Fallon and Shiloh accelerated after the 1960s, while the Black population grew through continued migration from the South and natural increase. By 2020, the city had shifted from a 90% white population in 1970 to a 57% white and 32% Black population. The West End remained predominantly white and middle-class, while the East End and North Side became heavily Black and lower-income. The Dutch Hollow neighborhood, once Irish, became a mixed-race area with a growing Hispanic presence (now 3.4% of the city). The Asian population is tiny: East/Southeast Asian communities make up 0.5%, and Indian-subcontinent residents account for 0.3%, with no single neighborhood concentration. The city’s Hispanic population, while small, has grown from near-zero in 1990, driven by Mexican and Central American immigrants working in construction and service industries, with a small cluster forming in the Dutch Hollow area. The college-educated share of 28.0% is below the national average, reflecting the city’s working-class roots and the loss of higher-income white households to the suburbs.
The future
Belleville’s population is likely to continue its gradual decline from a peak of 44,478 in 2000 to the current 41,722, as the city struggles to retain middle-class families of any race. The white population is aging and shrinking, while the Black population is plateauing. The Hispanic share is growing slowly but from a very low base, and the foreign-born population remains negligible. The city is not tribalizing into distinct enclaves so much as it is becoming more racially polarized between the predominantly white West End and the predominantly Black East End and North Side. The Historic Downtown has seen modest reinvestment, attracting some young professionals and empty-nesters, but it remains a small enclave. Over the next 10-20 years, Belleville will likely become a smaller, older, and more Black city, with the white population continuing to concentrate in the western neighborhoods and the Black population in the east. The Hispanic and Asian populations will remain small and dispersed. For a mover, this means a city with a strong sense of history and a low cost of living, but with limited economic dynamism and a demographic trajectory that favors stability over growth.
Belleville is becoming a smaller, older, and more racially polarized city, with a stable but shrinking population and a working-class economy. For someone moving in now, it offers affordable historic housing and a central location in the St. Louis metro, but the demographic trends point to continued white flight and a growing concentration of poverty in the eastern neighborhoods. The city’s future depends on whether it can attract new residents—particularly families and professionals—to reverse the population decline and bridge the racial and economic divides that define its neighborhoods.
* Values derived from national, state, county, city and local statistics and may differ in a specific area. Last updated: 2026-04-23T08:55:30.000Z
Narrative content on this page is AI-generated and may contain mistakes. Verify any details that matter before acting on them.
ReloMaps may earn a commission from affiliate links at no extra cost to you.