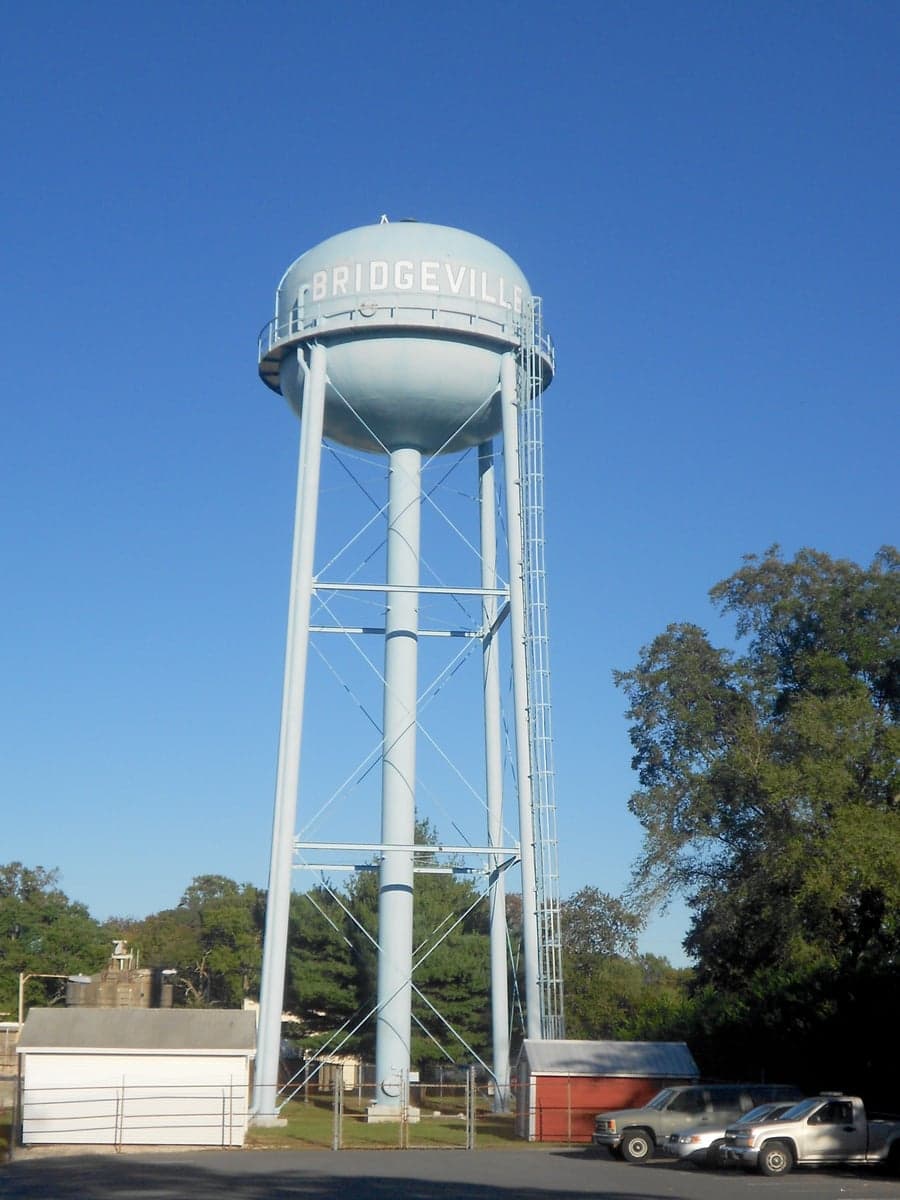
Photo: Wikipedia
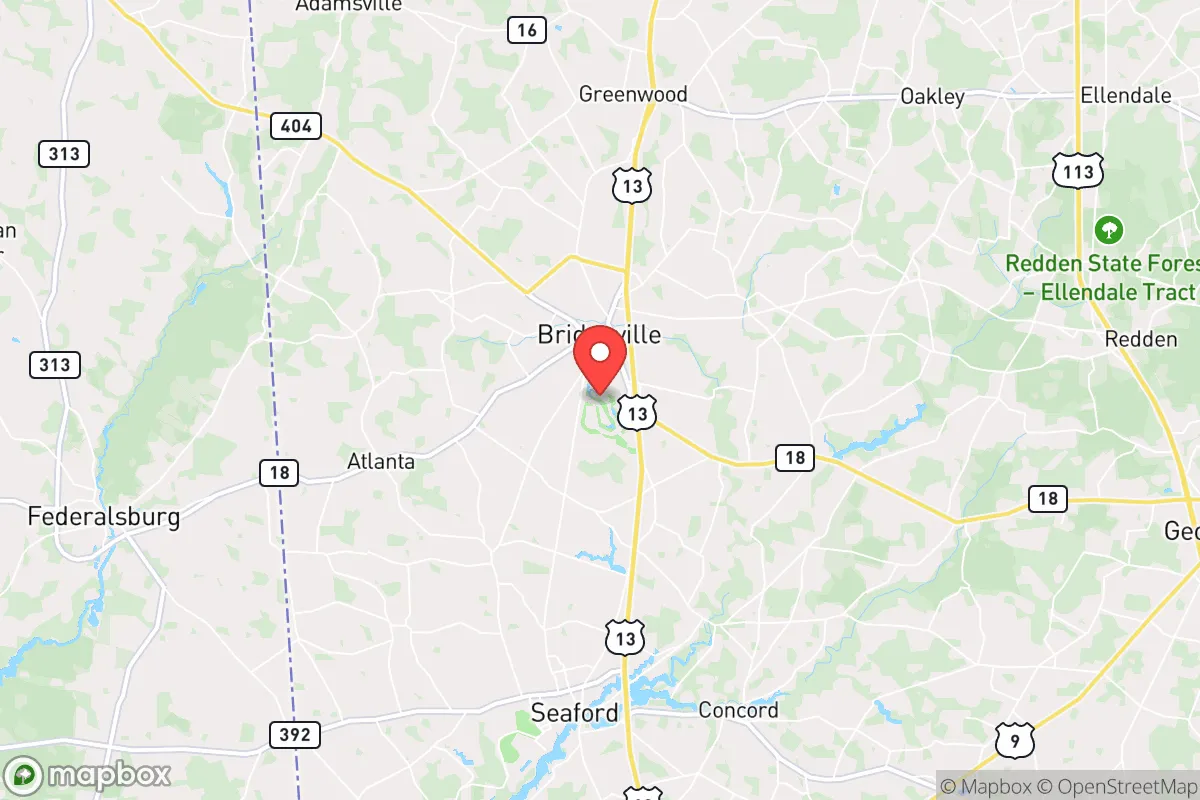
Demographics of Bridgeville, DE
Affluence Level in Bridgeville, DE
A middle-class area roughly in line with national averages across income, home values, education, and employment.
People of Bridgeville, DE
Bridgeville, Delaware, is a small town of 2,661 residents with a distinctly working-class character, where a majority-white population (60.8%) coexists with significant Black (22.7%) and Hispanic (14.2%) communities. The town’s identity is shaped by its agricultural roots and its role as a regional service hub, with a relatively low college attainment rate of 36.3% reflecting a population that values practical skills and local employment. Despite its small size, Bridgeville maintains a tight-knit, family-oriented atmosphere, where church and community events remain central to daily life.
How the city was settled and grew
Bridgeville’s human history begins with the Nanticoke people, who inhabited the area before European settlement. The town itself was formally laid out in 1806 along the banks of the Nanticoke River, with the arrival of English and Scots-Irish farmers who were drawn by the fertile bottomlands and the promise of land grants from the Delaware state government. These early settlers established the Old Town district around the original crossroads of Main Street and Market Street, building simple frame houses and a handful of brick structures that still stand today. The construction of the Delaware Railroad in the 1850s transformed Bridgeville into a shipping point for grain, lumber, and later, peaches and strawberries, attracting a wave of German and Irish laborers who settled in the Railroad District along the tracks. By the early 20th century, the town’s economy was dominated by canneries and packing houses, which drew a small number of Black families from the Eastern Shore of Maryland and Virginia, who established the South Bridgeville neighborhood near the industrial facilities. The population remained overwhelmingly white and native-born through the mid-20th century, with the 1950 census recording a population of just over 1,200, nearly all of whom were of European descent.
Modern era (post-1965)
The post-1965 era brought gradual demographic change to Bridgeville, driven by the decline of the canning industry and the expansion of regional agriculture into poultry and grain. The 1970s and 1980s saw an influx of Black families from nearby Sussex County, many of whom were drawn by affordable housing and employment at the Bridgeville Poultry Plant (now closed), settling in the West Side neighborhood around Cannon Street. The 1990s and 2000s brought a new wave of Hispanic immigrants, primarily from Mexico and Central America, who arrived to work in the poultry processing plants and mushroom farms that had become the backbone of the local economy. These families concentrated in the East Bridgeville area, near the industrial park and along Route 404, where rental housing and mobile home parks offered affordable entry points. The 2020 census data shows that the Hispanic share of the population (14.2%) has stabilized, while the Black share (22.7%) has grown modestly, reflecting both natural increase and continued in-migration from the broader Delmarva region. The white population, while still a majority, has declined from over 80% in 1990 to 60.8% today, as younger white families have moved to larger towns like Seaford and Georgetown for better job opportunities. The foreign-born share (5.2%) is modest but concentrated among the Hispanic community, with very few East/Southeast Asian (0.8%) or Indian (0.2%) residents, reflecting the town’s limited appeal to professional immigrants.
The future
Bridgeville’s population is likely to continue its slow diversification, though the pace will be tempered by the town’s limited housing stock and lack of major employers. The Hispanic community is expected to grow modestly through natural increase, but the absence of new immigrant streams suggests it will plateau rather than surge. The Black population is likely to remain stable or grow slightly, as families from the surrounding rural areas continue to move into the South Bridgeville and West Side neighborhoods. The white population will likely continue its gradual decline, as younger residents leave for college and careers in Wilmington or Salisbury, Maryland, and are not replaced by new white in-migrants. The town is not tribalizing into distinct ethnic enclaves—neighborhoods remain mixed, with no single group dominating any area—but it is slowly homogenizing in terms of income and education, as the college-educated share (36.3%) remains below the state average. The next 10 to 20 years will likely see Bridgeville remain a small, stable, working-class town, with a population that is slightly more diverse than today but still predominantly white and native-born.
For someone moving in now, Bridgeville offers a quiet, affordable, and family-oriented community where neighbors know each other and life moves at a slower pace. The town is becoming slightly more diverse but remains culturally conservative and rooted in its agricultural past. It is not a place of rapid change or cosmopolitan energy, but rather a steady, predictable environment where the values of hard work and community still hold sway.
* Values derived from national, state, county, city and local statistics and may differ in a specific area. Last updated: 2026-04-30T04:02:47.000Z
Narrative content on this page is AI-generated and may contain mistakes. Verify any details that matter before acting on them.
ReloMaps may earn a commission from affiliate links at no extra cost to you.