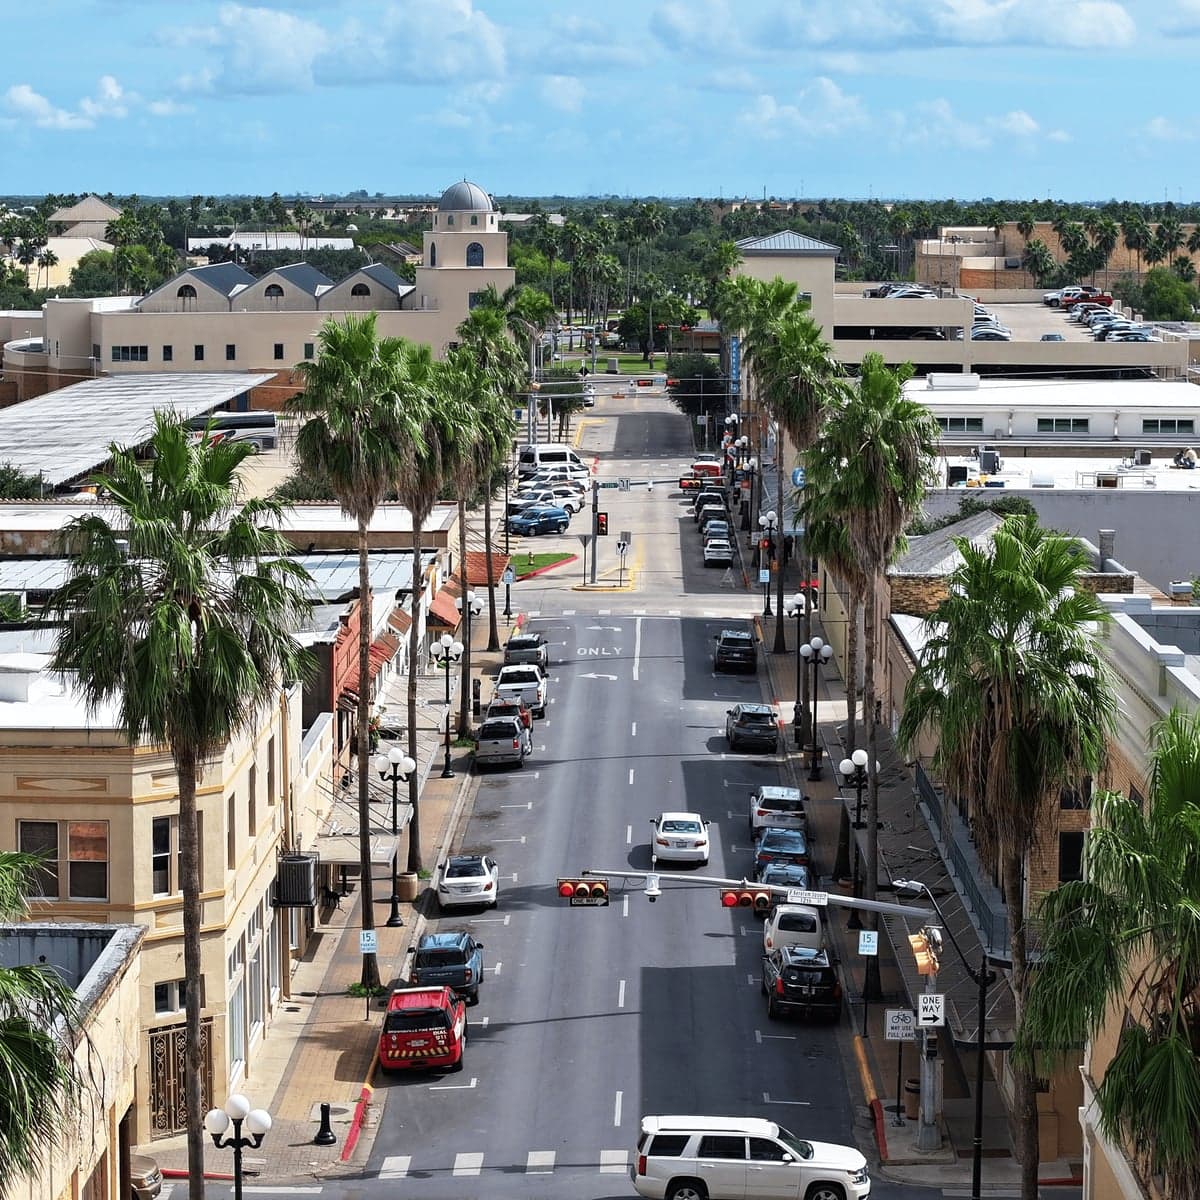
Photo: brownsvilletx.gov
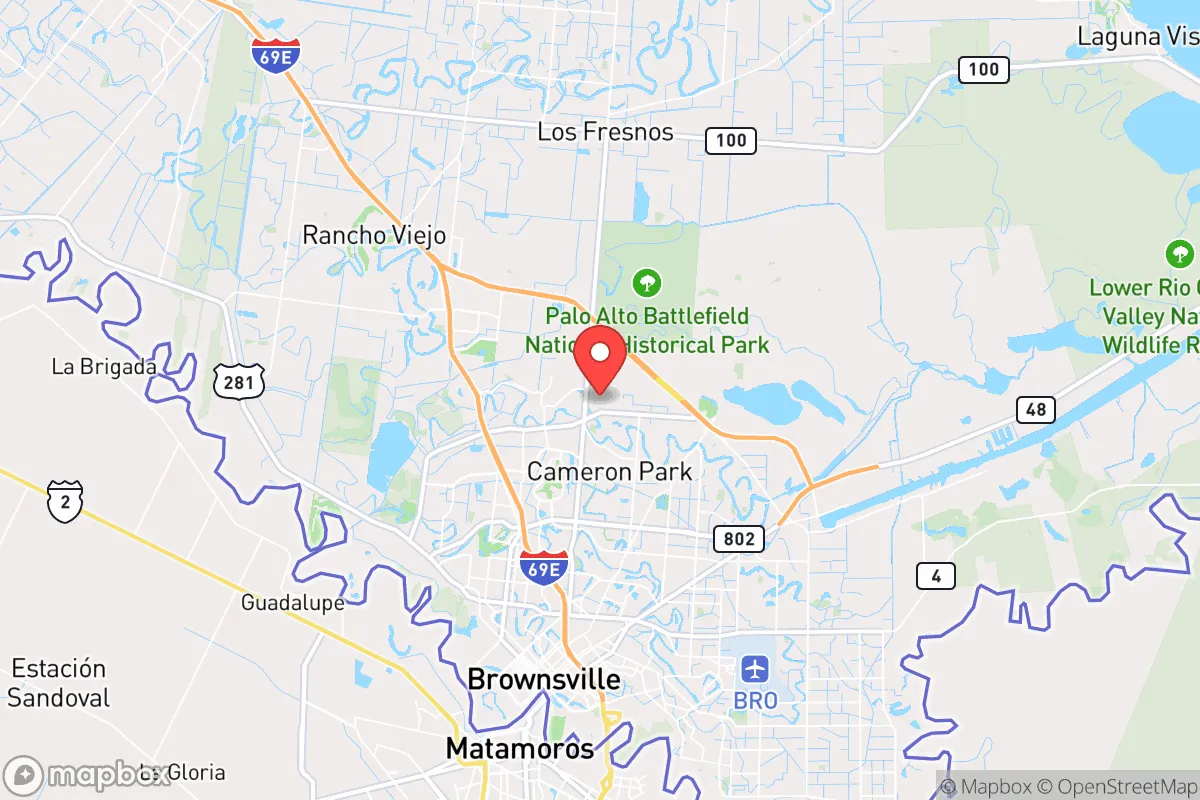
Demographics of Brownsville, TX
Affluence Level in Brownsville, TX
A below-average socioeconomic profile. Incomes, home values, and educational attainment trail the U.S., with higher poverty and unemployment.
People of Brownsville, TX
Brownsville, Texas, is a city of 188,023 residents where 94.2% identify as Hispanic, making it one of the most predominantly Hispanic cities of its size in the United States. The foreign-born population stands at 16.5%, and only 4.2% of residents identify as non-Hispanic white. This demographic reality is rooted in a distinct history of borderland settlement, where waves of migration from Mexico and Spain, rather than from other U.S. regions, have shaped the city's character as a deeply bicultural, family-oriented community with a strong Catholic and conservative social fabric.
How the city was settled and grew
Brownsville was founded in 1848 by American entrepreneur Charles Stillman on the northern bank of the Rio Grande, immediately after the Mexican-American War. The original settlers were a mix of Anglo-American merchants and soldiers, but the foundational population was overwhelmingly Mexican and Spanish-descended families who had lived in the region for generations under Spanish and Mexican rule. These early residents established the historic Old City Cemetery and the core of what is now Downtown Brownsville, building adobe homes and trading posts along what became Elizabeth Street. The city's growth accelerated after the arrival of the railroad in the 1880s and the development of the citrus and cotton industries, which drew additional Mexican laborers. By the early 20th century, neighborhoods like Southmost (south of the railroad tracks) became densely populated by Mexican immigrant families working in agriculture and the railroad yards, while Anglo merchants and professionals clustered in the East Brownsville area near the port. The 1910 Mexican Revolution sent a significant wave of refugees north, many settling in Las Prietas and other colonias along the river, establishing a pattern of cross-border family ties that persists today.
Modern era (post-1965)
The post-1965 period, following the Hart-Cellar Act, saw a continuation rather than a transformation of Brownsville's demographic trajectory. Unlike many U.S. cities that experienced a surge of Asian or Indian subcontinent immigration, Brownsville's foreign-born population (16.5%) remains overwhelmingly Mexican. The city's East/Southeast Asian community is just 0.6%, and the Indian subcontinent population is 0.2%, reflecting the city's limited draw for professional immigrants compared to Houston or Dallas. The major domestic shift was the suburbanization of middle-class Hispanic families into newer developments like Rancho Viejo and Palm Valley, which are now majority-Hispanic subdivisions with higher homeownership rates. Meanwhile, the Central Brownsville neighborhoods around the University of Texas Rio Grande Valley campus have seen an influx of younger, college-educated Hispanic residents, though the city's overall college attainment rate remains low at 22.3%. The non-Hispanic white population, never large, has declined from roughly 10% in 1990 to 4.2% today, as many Anglo families relocated to suburban areas in Cameron County or to the nearby city of Harlingen.
The future
Brownsville's population is heading toward even greater Hispanic homogeneity, with the non-Hispanic white share projected to fall below 3% by 2035. The city is not tribalizing into distinct ethnic enclaves; rather, it is homogenizing as a predominantly Mexican-American community where class divides (between older colonias and newer subdivisions) are more significant than racial ones. The foreign-born share is plateauing, as second- and third-generation Mexican-Americans now make up the majority of the population, and new immigration from Mexico has slowed due to stricter border enforcement. The small East/Southeast Asian and Indian communities are likely to remain niche populations tied to the University of Texas Rio Grande Valley and the medical sector, with no signs of rapid growth. The next decade will likely see continued infill development in North Brownsville near the SpaceX facility at Boca Chica, which may attract a modest influx of non-Hispanic engineers and technicians, but this will not meaningfully alter the city's demographic character.
For someone moving to Brownsville now, the city offers a stable, culturally cohesive environment where Spanish is heard as often as English, family networks are dense, and the political and social values lean conservative. The population is not diversifying in the way many Sun Belt cities are; instead, it is deepening its existing identity as a border community with deep roots in Mexican heritage. New residents should expect to integrate into a society where the majority population shares a common cultural background, and where the small non-Hispanic minority is concentrated in specific professional and academic circles.
* Values derived from national, state, county, city and local statistics and may differ in a specific area. Last updated: 2026-04-11T04:40:45.000Z
Narrative content on this page is AI-generated and may contain mistakes. Verify any details that matter before acting on them.
ReloMaps may earn a commission from affiliate links at no extra cost to you.