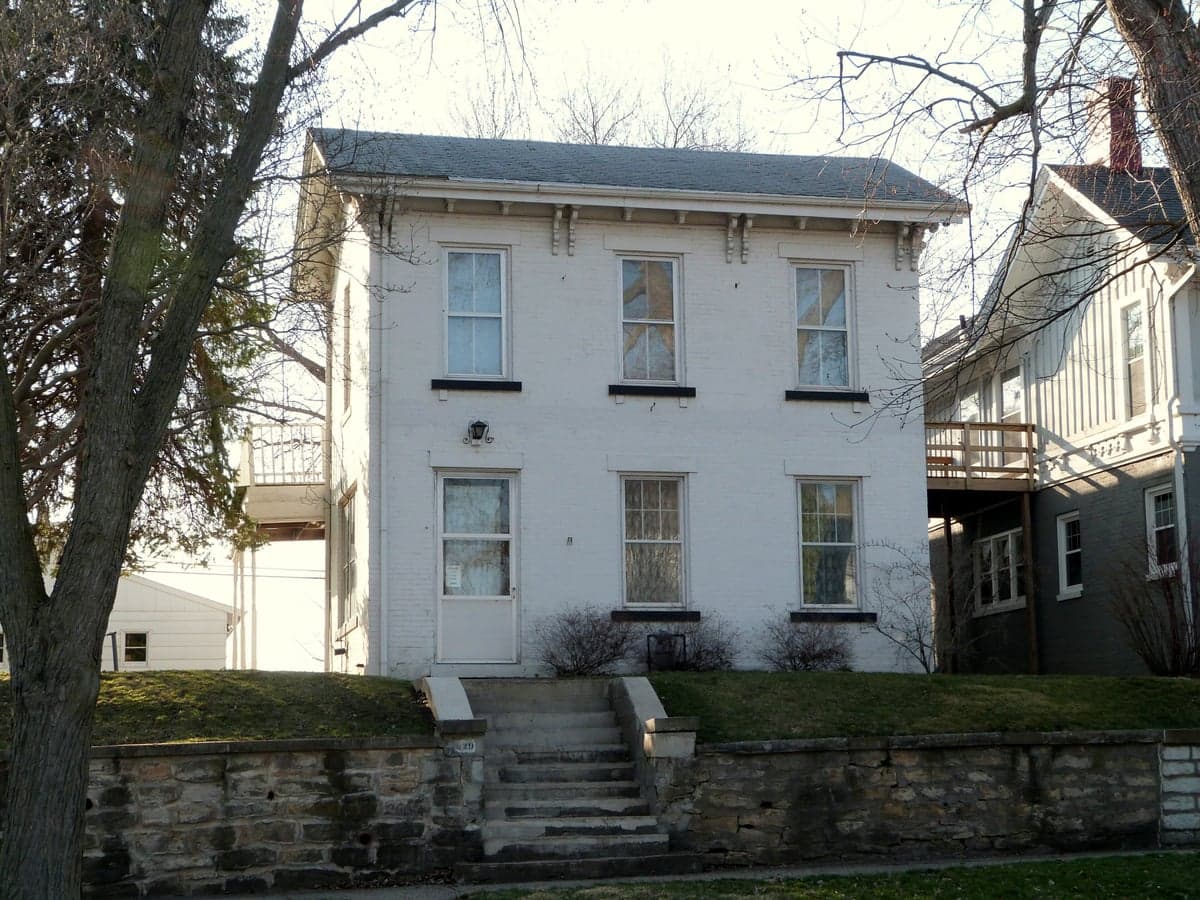
Photo: Wikipedia
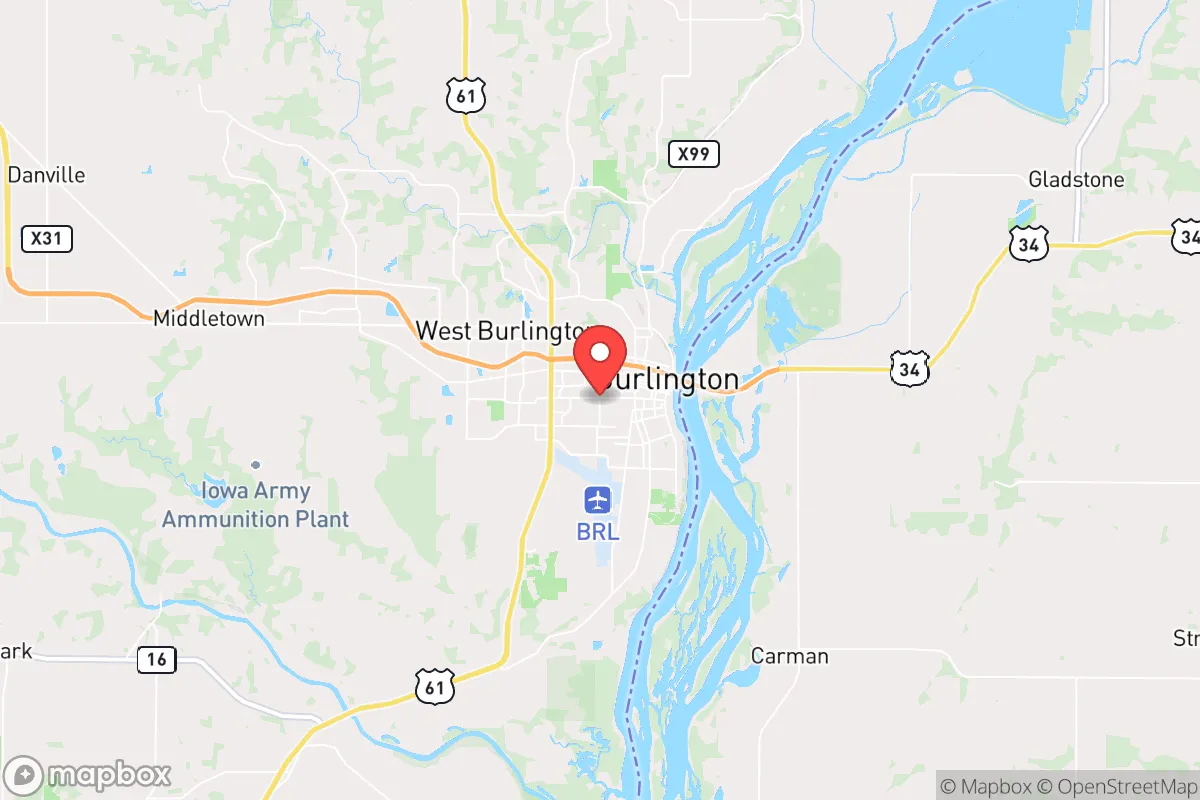
Demographics of Burlington, IA
Affluence Level in Burlington, IA
A middle-class area roughly in line with national averages across income, home values, education, and employment.
People of Burlington, IA
The people of Burlington, Iowa, today number roughly 23,800, forming a predominantly white (82.4%) community with a small but established Black population (5.6%) and a growing Hispanic presence (4.0%). The city’s character is rooted in its Mississippi River industrial past, with a population density of about 1,200 people per square mile that gives it a compact, walkable feel compared to sprawling suburbs. Distinctive markers include a strong blue-collar identity tied to manufacturing and agriculture, a relatively low college attainment rate (23.0%), and a foreign-born share (2.1%) that is well below the national average, reflecting limited recent immigration. Burlington is a place where generational roots run deep, and newcomers often notice the quiet, family-oriented pace of life.
How the city was settled and grew
Burlington’s human history began with the Sauk and Meskwaki tribes, who used the river bluffs as seasonal camps before European-American settlement accelerated after the Black Hawk Purchase of 1832. The city was officially platted in 1833, and its early growth was driven by its position as a territorial capital (1837–1840) and a hub for the Mississippi River steamboat trade. The first major wave of settlers were Yankee and Mid-Atlantic migrants—farmers, merchants, and craftsmen from New England, New York, and Pennsylvania—who built the Heritage Hill neighborhood, a historic district of Victorian homes that still anchors the city’s identity. A second wave arrived with the railroad boom of the 1850s–1880s, bringing German and Irish immigrants who worked on the tracks and in the burgeoning lumber and milling industries. These groups settled in West Burlington and the North Hill area, where modest frame houses and Catholic churches remain landmarks. By 1900, Burlington’s population had swelled to over 23,000, fueled by the Iowa Ordnance Plant (later the Army Ammunition Plant) and the city’s role as a rail and river shipping point for coal and grain. The Downtown district, with its brick commercial buildings, was the economic heart, while Spring Street became a working-class corridor for German and Irish families.
Modern era (post-1965)
After the 1965 Hart-Cellar Act, Burlington saw only modest immigration, unlike larger Midwestern cities. The foreign-born share remained below 3% through the 1990s, and the city’s demographic shifts came primarily from domestic migration. The post-1965 era was defined by suburbanization: middle-class white families moved to West Burlington and Middletown (an unincorporated area just north), leaving the older Heritage Hill and Downtown neighborhoods with aging populations and declining property values. The Black population, which had grown during the World War II era when the ammunition plant attracted African American workers from the South, concentrated in the South Hill area near the river, where public housing and older rental stock offered affordable entry points. Today, Black residents make up 5.6% of the city, a share that has held steady since the 1980s. The Hispanic population (4.0%) began growing in the 1990s, driven by work in meatpacking and agriculture; these families have settled primarily in West Burlington and along the Highway 34 corridor, where newer apartment complexes and mobile home parks provide lower-cost housing. East/Southeast Asian residents (0.4%) and Indian-subcontinent residents (1.0%) are small but visible, with Indian families often connected to the medical and engineering sectors at the local hospital and manufacturing plants. The city’s college-educated share (23.0%) is low, reflecting a workforce that still relies on manufacturing, logistics, and agriculture rather than knowledge-economy jobs.
The future
Burlington’s population is slowly declining—down from 25,000 in 2010—and the trend is likely to continue as younger residents leave for larger metros like Des Moines or the Quad Cities. The city is not tribalizing into distinct ethnic enclaves; rather, it is homogenizing as the white majority ages and out-migration reduces diversity. The Hispanic population is growing but from a small base, and these families are assimilating into existing neighborhoods rather than forming a concentrated barrio. The Black population is plateauing, with no new migration streams to replace those who leave. The Indian and East/Southeast Asian communities are too small to shape neighborhood character. Over the next 10–20 years, Burlington will likely become older, whiter, and more economically stagnant unless new industry or remote-work migration reverses the trend. The Heritage Hill and Downtown districts may see reinvestment as historic preservation attracts retirees and niche tourism, but the broader population will continue to shrink.
For someone moving in now, Burlington offers a stable, low-cost, family-oriented environment with deep community ties—but it is a place where the population is contracting, not expanding. Newcomers will find a city that values tradition and self-reliance, with limited ethnic diversity and a workforce geared toward manufacturing and agriculture rather than tech or services. The bottom line: Burlington is becoming a quieter, older version of itself, ideal for those seeking affordability and a slower pace, but less suited for those looking for demographic dynamism or rapid economic growth.
* Values derived from national, state, county, city and local statistics and may differ in a specific area. Last updated: 2026-04-30T03:10:07.000Z
Narrative content on this page is AI-generated and may contain mistakes. Verify any details that matter before acting on them.
ReloMaps may earn a commission from affiliate links at no extra cost to you.