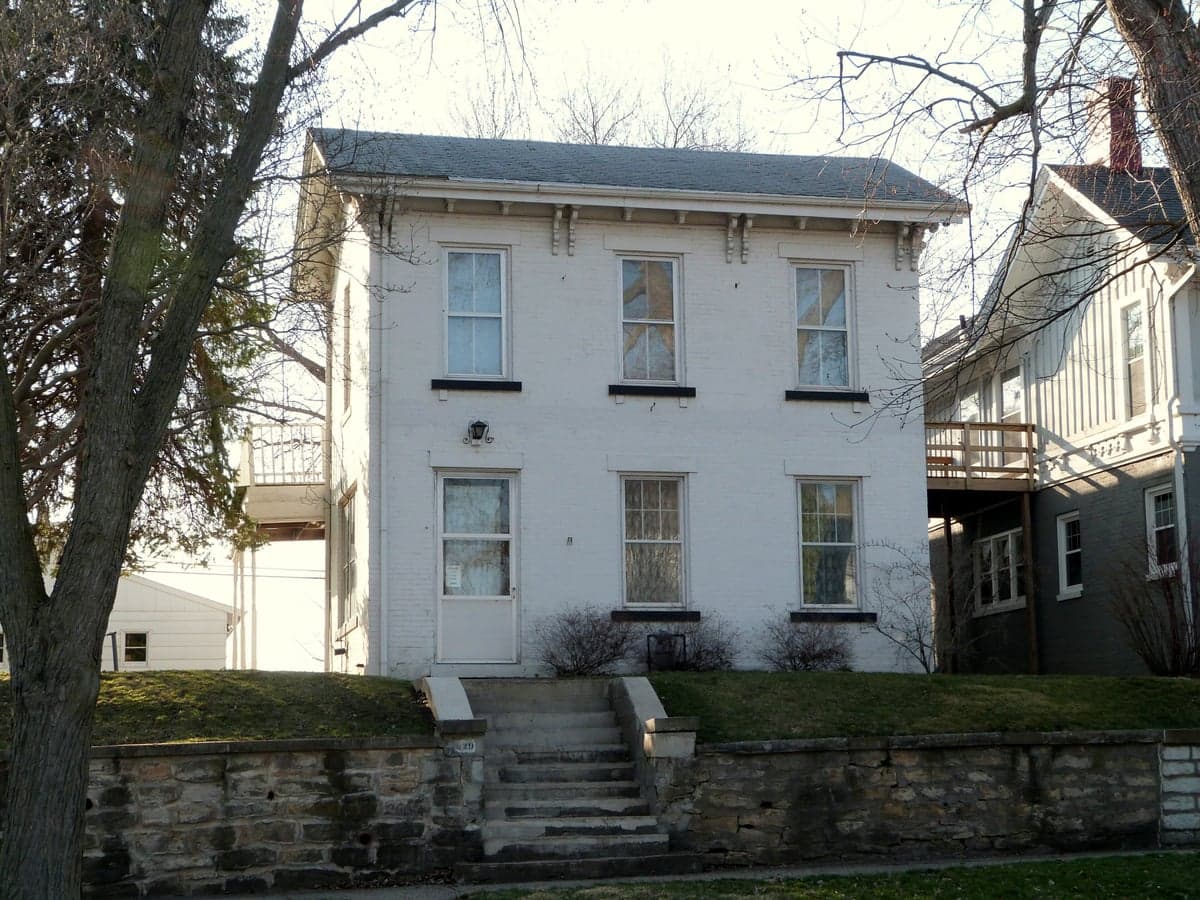
Photo: Wikipedia
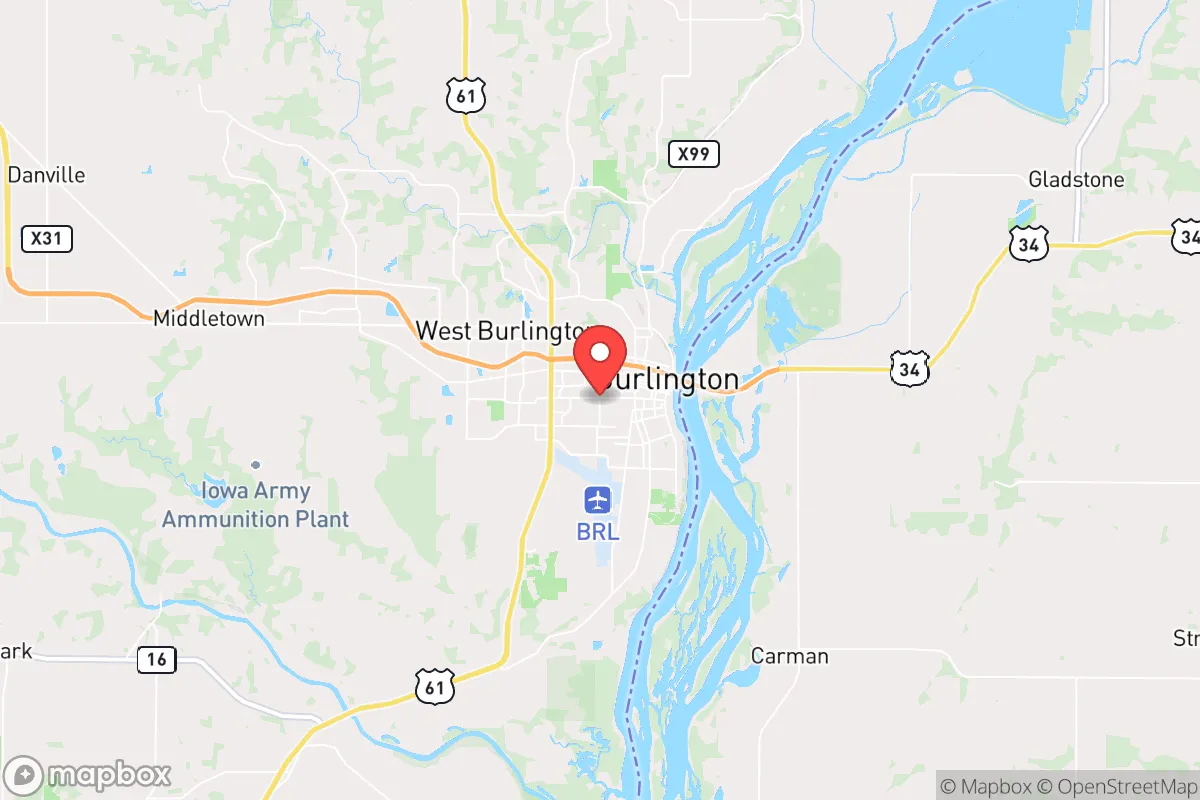
Quality of Life in Burlington, IA
A high quality of life with strong walkability, manageable living costs, healthy neighborhood signals, and solid amenity access.
What does Quality of Life tell us?
Quality of Life blends cost of living, nearby amenities, socioeconomic signals, and neighborhood character. City-level scores represent the whole municipality; individual neighborhoods can differ.
What does this tell us?
Quality of Life blends cost of living, nearby amenities, socioeconomic signals, and neighborhood character. City-level scores represent the whole municipality; individual neighborhoods can differ.
Cost of Living
36% below national average
The Real Cost of Living in Burlington, IA for 2026
| Tier | Individual | Family (4) |
|---|---|---|
| Survival | $15k | $28k |
| Comfortable | $26k | $38k |
| Luxury | $100k+ | $155k+ |
| Elite (Top 5%) | $126k+ | $195k+ |
147%
The Area Signal
A metric tracking the socioeconomic signals of the area.
Hobbies
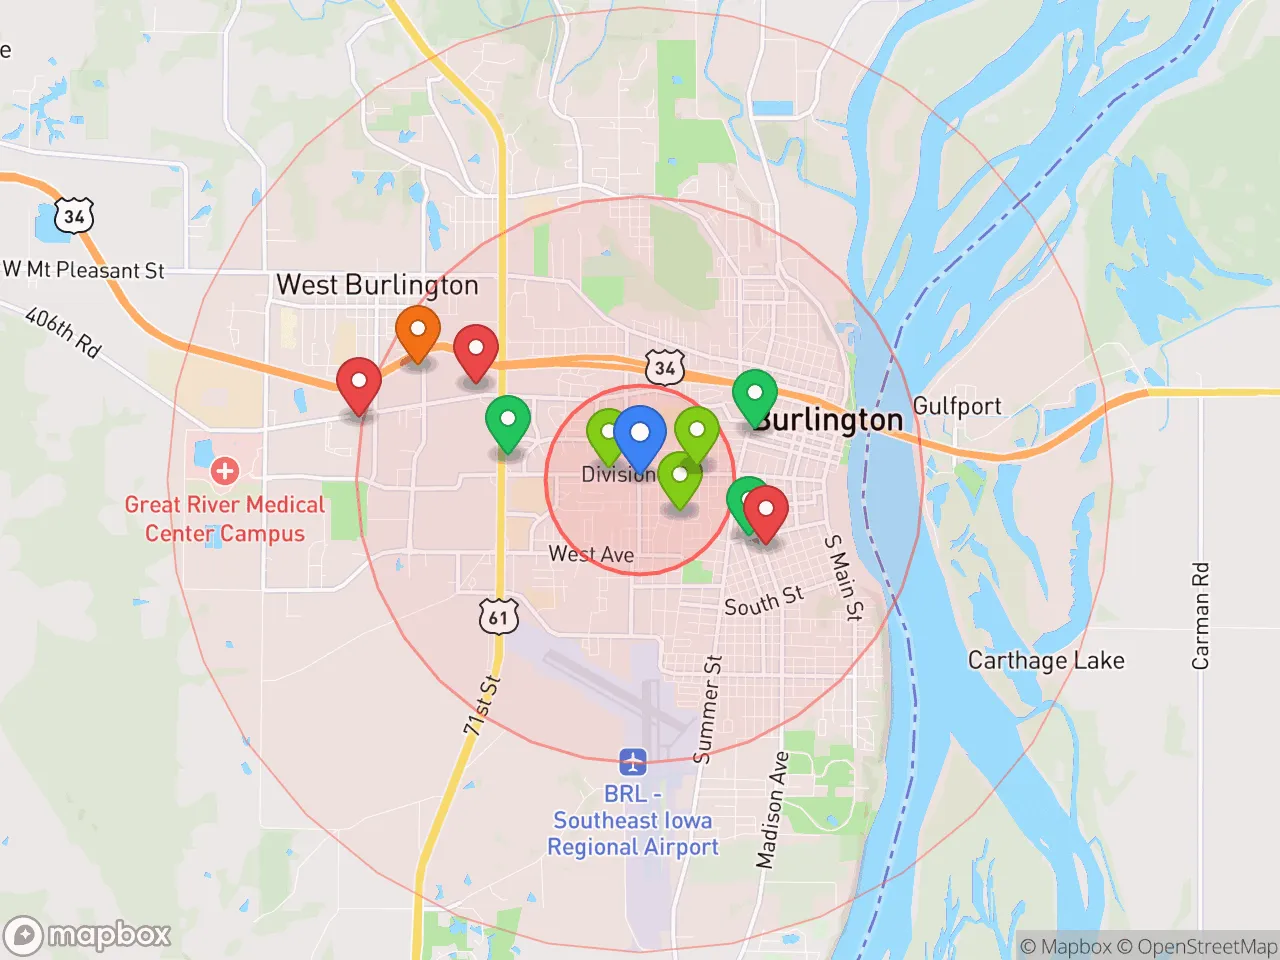
Explore the areaGroceries
4 within 10 miles
Gas
11 within 10 miles
Hospital
4 within 20 miles
Airport
ORD — O'Hare International
Post Office
USPS — Burlington, IA
Critical Amenities
Quality-of-Life Analysis
Burlington, Iowa, offers a notably low cost of living that attracts a mix of retirees, manufacturing workers, and remote professionals seeking affordability without sacrificing small-city amenities. With a cost-of-living index of 64 (36% below the U.S. average), the area’s median household income of roughly $47,000 aligns with its modest housing market, drawing residents who prioritize financial stability over high earnings. The population of about 23,000 is older than the national median (38.5 years), with a significant share of long-term locals and a growing number of out-of-state buyers drawn by the region’s quiet pace and Mississippi River setting.
How housing costs and everyday expenses compare to nearby cities
Burlington’s housing market is among the most affordable in southeast Iowa. The median home value sits at $115,800, roughly one-third the national median, while median rent is $931 per month—well below the $1,200+ averages in nearby Quad Cities (Davenport, Moline, Rock Island). The overall cost-of-living index of 64 means groceries, utilities, and transportation are all significantly cheaper than in Des Moines (index ~90) or Chicago (index ~100+). A typical commute of 17 minutes keeps fuel and vehicle wear low, a practical advantage for workers at local employers like the Iowa Army Ammunition Plant or the Burlington Medical Center. Property taxes in Des Moines County average about 1.5% of assessed value, slightly higher than some rural counties but offset by the low home prices. For renters, the median rent consumes roughly 24% of the median household income, well within the 30% affordability threshold.
What daily life is like for families, retirees, and remote workers
Daily life in Burlington centers on a compact downtown along the Mississippi River, with the Burlington Riverfront Trail and Crapo Park providing outdoor recreation within a 10-minute drive of most neighborhoods. The Burlington Community School District serves about 3,500 students, with a graduation rate near 90%, and the presence of Southeastern Community College offers vocational and associate-degree pathways. Groceries, healthcare, and retail are concentrated along the Agency Street corridor, with Hy-Vee and Walmart as primary anchors. For remote workers, fiber-optic internet is available through Mediacom and CenturyLink, though speeds lag behind larger metros—typical plans offer 100–200 Mbps. The area lacks a major airport (the nearest commercial service is Quad Cities International, 75 miles north), but Amtrak’s California Zephyr stops daily at the Burlington station, connecting residents to Chicago and Denver. The rhythm is unhurried: farmers’ markets, high school sports, and riverfront festivals like the Burlington Steamboat Days define the social calendar.
Burlington is best suited for cost-conscious families, retirees on fixed incomes, and remote workers who value low overhead over urban amenities. The combination of a 17-minute commute, sub-$1,000 rent, and a cost-of-living index 36% below the national average makes it a practical choice for those who can tolerate limited nightlife and a slower economic pace. However, job seekers in specialized fields (tech, finance, biotech) will find few local opportunities beyond manufacturing, healthcare, and education. For anyone prioritizing affordability, river access, and a tight-knit community, Burlington delivers a stable, low-stress quality of life that larger Midwestern cities cannot match at this price point.
Crime in Burlington, IA
Generally safer than 58% of comparable U.S. locations.
Violent CrimeViolent Crime Analysis
Property CrimeProperty Crime Analysis
Crime Analysis
Burlington, Iowa, reports a violent crime rate of 254.7 incidents per 100,000 residents and a property crime rate of 1,303.3 per 100,000, placing it above the national average for both categories. While not among the most dangerous cities in the state, these figures indicate a community where residents face elevated risks, particularly from property offenses. The city’s location as a small, independent urban center in southeast Iowa—not a suburb of a large, liberal-leaning metro area—means its crime dynamics are shaped more by local economic conditions than by the progressive prosecutorial policies seen in larger jurisdictions.
Crime in context
Burlington’s violent crime rate of 254.7 per 100,000 is roughly 30% higher than the national average of 195 per 100,000 and significantly exceeds the Iowa state average of approximately 210 per 100,000. The property crime rate of 1,303.3 per 100,000 is about 40% above the national average of 932 per 100,000 and well above Iowa’s state average of roughly 1,100 per 100,000. These numbers place Burlington in a higher-risk tier among Iowa’s smaller cities, comparable to communities like Fort Madison or Keokuk. The elevated property crime rate is particularly notable, suggesting theft, burglary, and vehicle-related crimes are persistent concerns. Unlike larger metro areas such as Des Moines or Cedar Rapids—which have seen crime rates influenced by progressive district attorneys who emphasize diversion and reduced incarceration—Burlington’s justice system operates under more traditional, conservative-leaning local leadership, which may moderate but not eliminate these risks.
What residents experience
For daily life in Burlington, the property crime rate means residents face a tangible risk of break-ins, package theft, and vehicle vandalism, especially in areas with lower foot traffic or less street lighting. The violent crime rate, while lower than property crime, still translates to a noticeable number of aggravated assaults and robberies each year—roughly 25 to 30 violent incidents annually in a city of about 23,000 people. Most violent crime in Burlington is not random; it tends to involve individuals who know each other, often tied to disputes or substance abuse. Residents report feeling safest in the city’s established residential neighborhoods like the North Hill area and along the Mississippi River bluffs, while areas near the downtown core and industrial zones near the riverfront see more frequent police activity. The Des Moines County Sheriff’s Office and Burlington Police Department maintain a visible presence, but response times can vary in outlying parts of the city.
Neighborhood-level variation
Crime in Burlington is not evenly distributed. The highest concentration of property crime occurs in the central business district and along the Highway 61 corridor, where transient populations and commercial activity create more opportunities for theft. Conversely, neighborhoods like Sunnyside and the area around Crapo Park report significantly lower crime rates, with many blocks experiencing fewer than one property crime per year. The city’s relatively compact size means that even safer neighborhoods are within a short drive of higher-crime areas, so residents should remain vigilant regardless of location. Prospective movers should consult local crime maps and consider visiting neighborhoods at different times of day to gauge real-world conditions.
* Values derived from national, state, county, city and local statistics and may differ in a specific area. Last updated: 2026-04-30T03:10:07.000Z
Narrative content on this page is AI-generated and may contain mistakes. Verify any details that matter before acting on them.
ReloMaps may earn a commission from affiliate links at no extra cost to you.