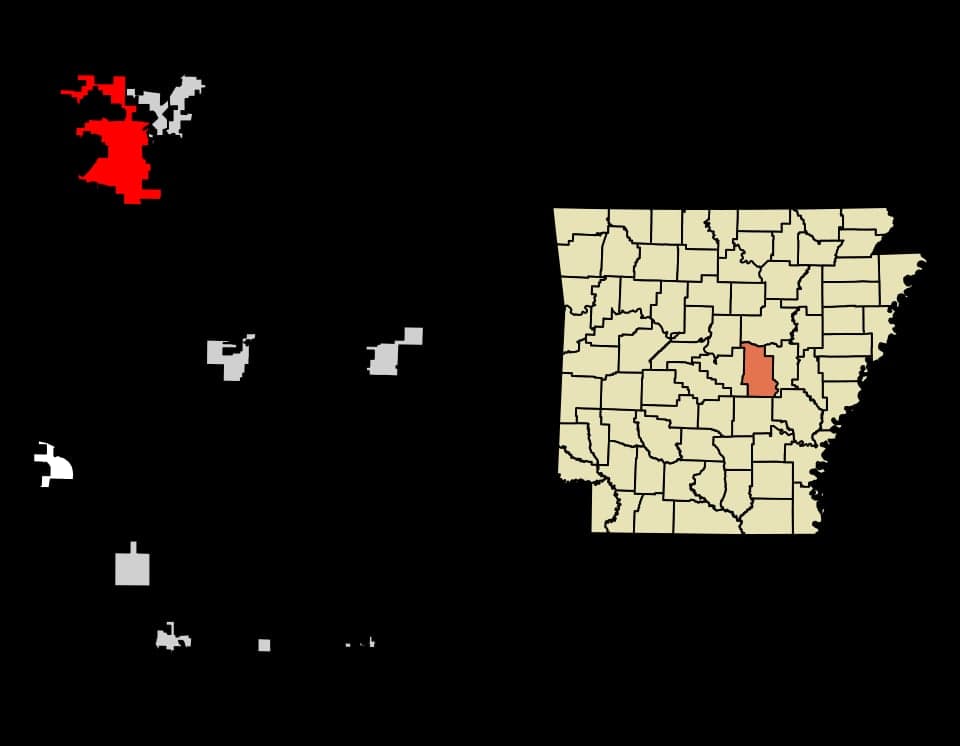
Photo: Wikipedia
Quality of Life in Cabot, AR
A high quality of life with strong walkability, manageable living costs, healthy neighborhood signals, and solid amenity access.
What does Quality of Life tell us?
Quality of Life blends cost of living, nearby amenities, socioeconomic signals, and neighborhood character. City-level scores represent the whole municipality; individual neighborhoods can differ.
What does this tell us?
Quality of Life blends cost of living, nearby amenities, socioeconomic signals, and neighborhood character. City-level scores represent the whole municipality; individual neighborhoods can differ.
Cost of Living
22% below national average
The Real Cost of Living in Cabot, AR for 2026
| Tier | Individual | Family (4) |
|---|---|---|
| Survival | $16k | $29k |
| Comfortable | $38k | $56k |
| Luxury | $103k+ | $160k+ |
| Elite (Top 5%) | $122k+ | $188k+ |
129%
The Area Signal
A metric tracking the socioeconomic signals of the area.
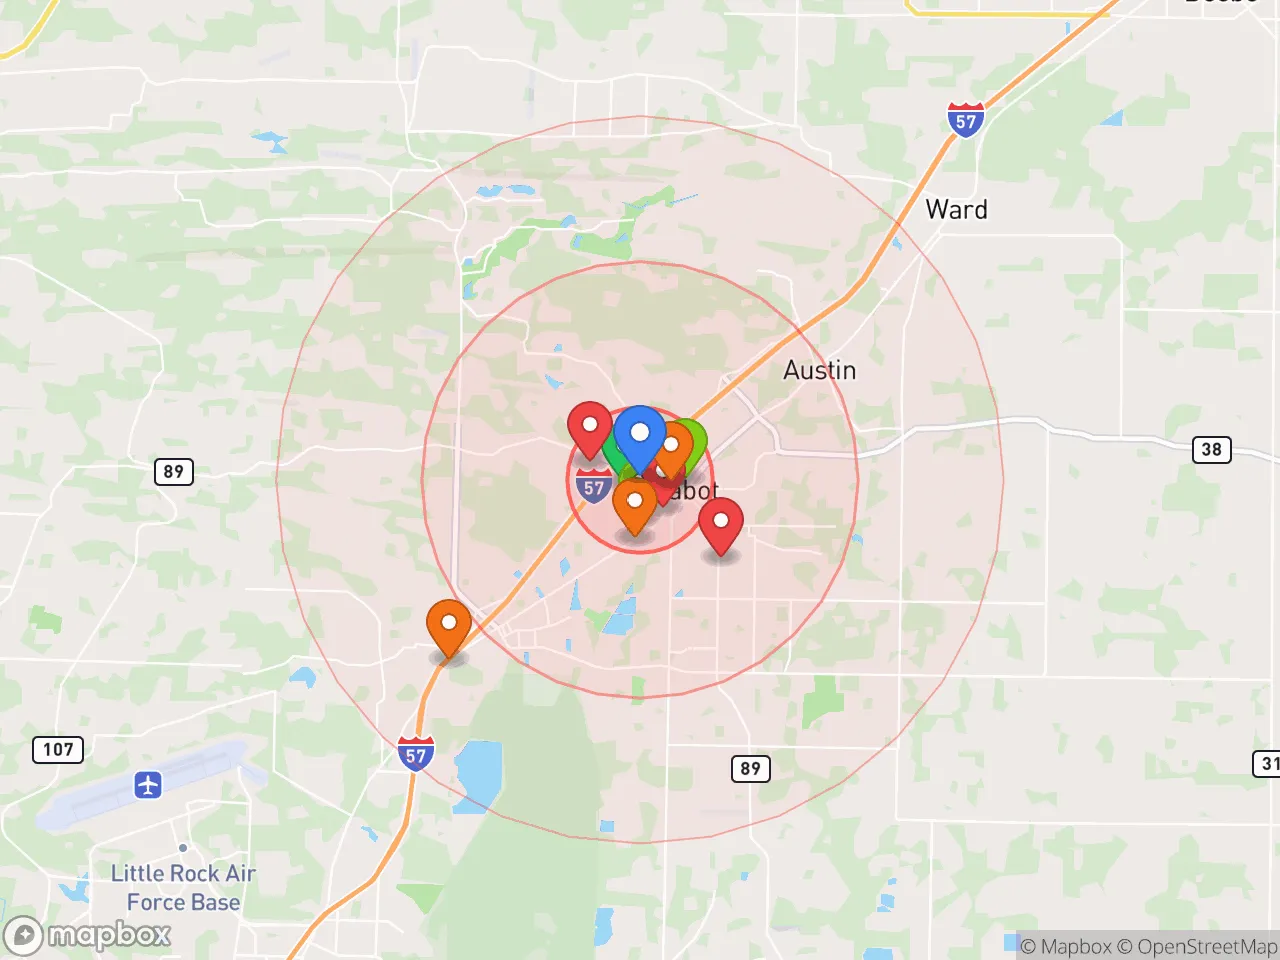
Hobbies
Explore the areaGroceries
3 within 10 miles
Gas
20 within 10 miles
Hospital
5 within 20 miles
Airport
BNA — Nashville International
Post Office
USPS — Cabot, AR
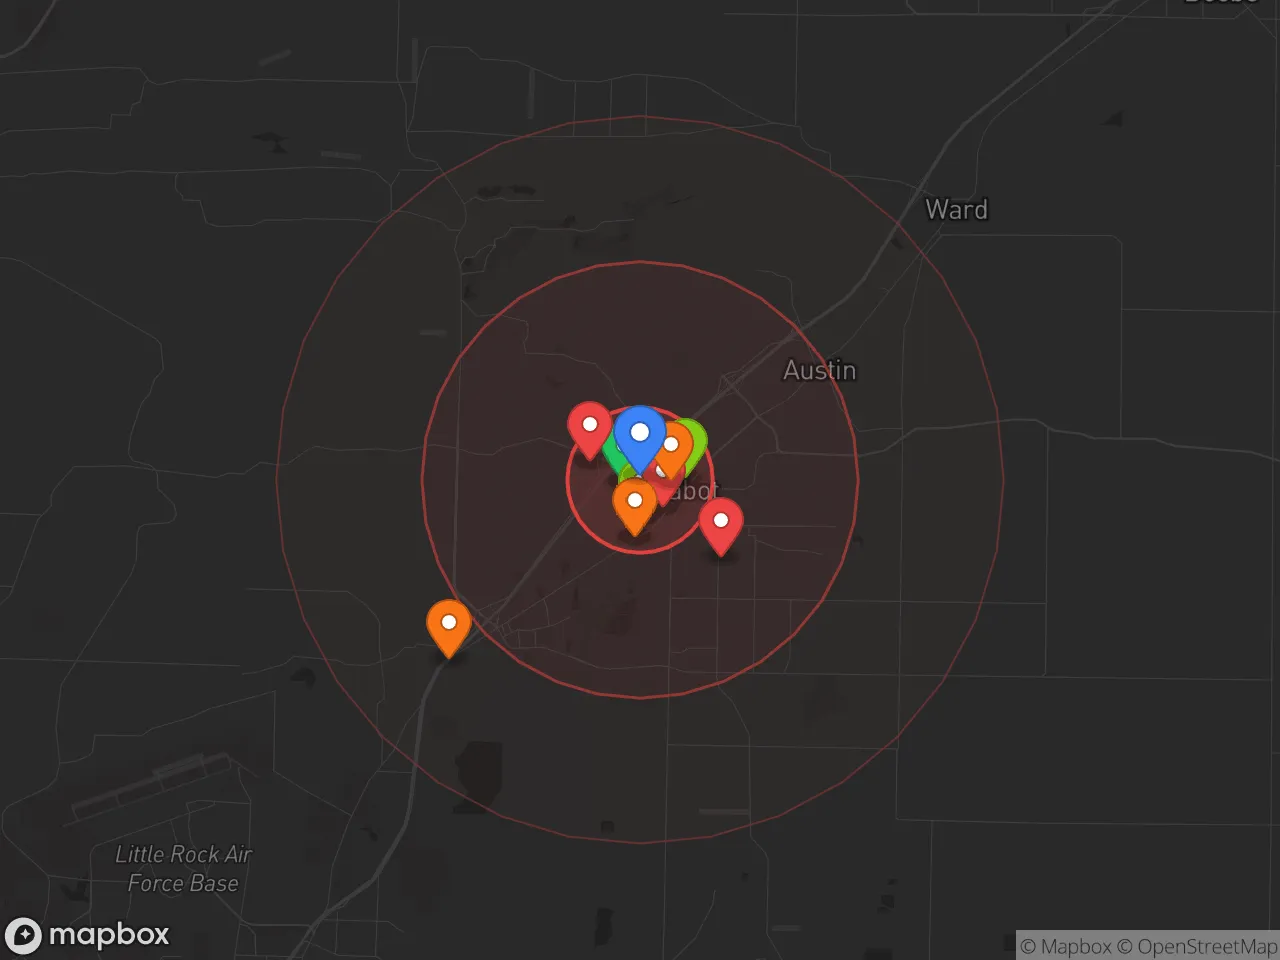
Critical Amenities
Quality-of-Life Analysis
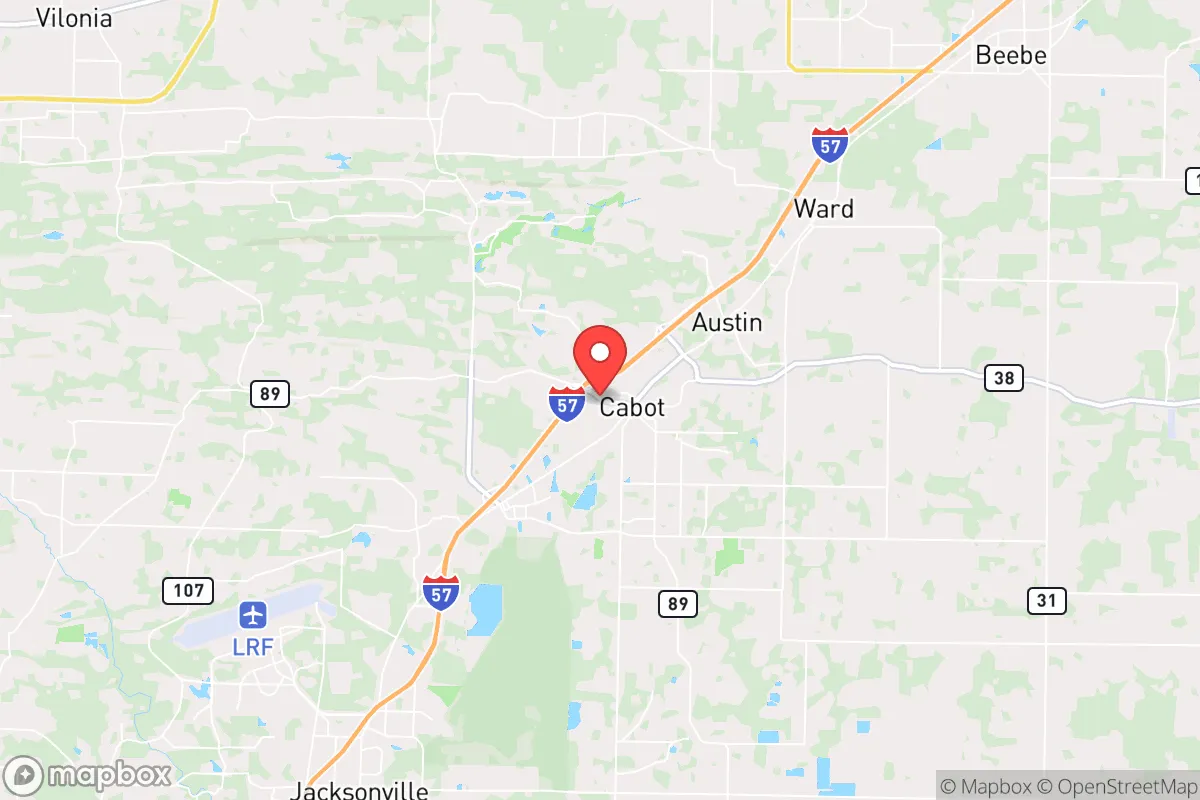
Cabot, Arkansas, presents a quality of life defined by affordable suburban stability, attracting a demographic mix of young families, military-affiliated households from nearby Little Rock Air Force Base, and long-term residents seeking lower costs without sacrificing access to a mid-sized metro. With a cost of living index of 78 (22% below the U.S. average), the city offers a notably lower financial barrier to homeownership and daily expenses compared to the national norm, while maintaining a median household income that supports a comfortable, if not affluent, middle-class lifestyle. The community’s character leans heavily toward family-oriented, with a strong emphasis on local schools, church involvement, and outdoor recreation, making it a deliberate choice for those prioritizing space and affordability over urban intensity.
Cost of living, housing affordability, and how Cabot compares to nearby areas
Cabot’s cost of living index of 78 is significantly lower than the national baseline, and this advantage is most visible in its housing market. The median home value sits at $197,000, roughly $100,000 below the national median, while median rent is $974 per month, well under the U.S. average of about $1,200. These figures make Cabot one of the more affordable options in central Arkansas, especially when compared to Little Rock (index ~85) or Conway (index ~82), where home values often exceed $250,000. The trade-off is a longer average commute of 28.6 minutes, slightly above the national average of 26 minutes, as many residents drive south to jobs in Little Rock (about 30 miles) or to the Air Force base in Jacksonville. Property taxes in Lonoke County are relatively low (typically under 0.6% of assessed value), further reducing monthly housing costs. For renters, the $974 median rent is attainable on a single median income, though inventory of rental units under $1,000 has tightened since 2023.
Local amenities, schools, and what daily life feels like for families
Daily life in Cabot centers on its highly rated public school system, which is the largest employer in the city and consistently ranks among the top in Arkansas for academic performance and extracurricular offerings. The Cabot School District serves over 10,000 students and draws families specifically for its strong sports programs and Advanced Placement options. For recreation, residents rely on the Cabot City Park (with walking trails, sports fields, and a splash pad) and the nearby Greers Ferry Lake (about 30 minutes north) for boating and fishing. Retail and dining are concentrated along Highway 67/167, with national chains like Walmart and local staples such as Bobby's Cafe anchoring the scene. The city lacks a vibrant nightlife or dense cultural offerings—most entertainment involves weekend trips to Little Rock’s River Market District or Verizon Arena. The rhythm is quiet and predictable: school events, church activities, and youth sports dominate evenings. Commuters appreciate the direct highway access, though traffic on Highway 67/167 can back up during peak hours, adding 5–10 minutes to the average 28.6-minute drive.
Cabot is best suited for families, military personnel stationed at Little Rock Air Force Base, and retirees seeking a low-cost, low-crime environment with good schools. Singles or young professionals without children may find the social scene limited and the commute to Little Rock’s job centers a drawback. The city’s affordability and school reputation make it a strong choice for those willing to trade urban amenities for space, safety, and a slower pace—provided they can tolerate the daily drive and the area’s limited diversity in housing stock and dining options.
Crime in Cabot, AR
Generally safer than 72% of comparable U.S. locations.
Violent CrimeViolent Crime Analysis
Property CrimeProperty Crime Analysis
Crime Analysis
Cabot, Arkansas, presents a mixed safety profile for prospective residents. The city’s overall crime rates are notably higher than the national average, with violent crime at 370.1 incidents per 100,000 residents and property crime at 1,562.9 per 100,000. While Cabot is not among the most dangerous cities in Arkansas, these figures indicate that crime is a genuine concern, particularly when compared to the safest small towns in the state. The data suggests that residents face a higher-than-average risk of becoming victims of both violent and property offenses.
Crime in context
Cabot’s violent crime rate of 370.1 per 100,000 is roughly 5% higher than the national average of approximately 352 per 100,000, and significantly above the Arkansas state average of around 479 per 100,000. Property crime in Cabot, at 1,562.9 per 100,000, is about 15% higher than the national average of roughly 1,358 per 100,000. These numbers place Cabot in a moderate-risk category for a city of its size. However, it is important to note that Cabot is part of the larger Little Rock–North Little Rock–Conway metropolitan area. This proximity to a major urban center with higher crime rates can influence local crime patterns, including property crimes like vehicle theft and burglary that may be linked to regional criminal networks.
What residents experience
For those living in Cabot, the most common crime experience is property-related. The city’s property crime rate translates to a 1 in 64 chance of being a victim of larceny, burglary, or motor vehicle theft each year. Violent crime, while less frequent, still carries a 1 in 270 annual victimization risk. Aggravated assault makes up the majority of violent incidents. Residents often report that crime is not a constant, visible presence in daily life, but that theft from vehicles and occasional break-ins are recurring issues, particularly in neighborhoods near major roads or apartment complexes. The city’s police department is active, but like many departments in growing suburbs, it faces challenges in keeping pace with population growth and the associated demand for patrols and community policing.
Neighborhood-level variation
Crime in Cabot is not evenly distributed. The safest areas tend to be the newer, higher-value subdivisions on the city’s western and northern edges, such as those near Highway 89 and the Greystone community. These areas see very low rates of both violent and property crime. Conversely, older neighborhoods closer to the city’s core, particularly along Main Street and near the railroad tracks, report higher incidences of property crime. Apartment complexes and rental-heavy zones also tend to have more frequent police calls. Prospective residents should research specific street-level crime maps or speak with local law enforcement about their target neighborhood, as the difference in safety between blocks can be substantial. Overall, Cabot is a community where awareness and standard precautions—like locking cars and securing homes—are essential, rather than a place where fear of crime dominates daily life.
* Values derived from national, state, county, city and local statistics and may differ in a specific area. Last updated: 2026-05-03T20:21:49.000Z
Narrative content on this page is AI-generated and may contain mistakes. Verify any details that matter before acting on them.
ReloMaps may earn a commission from affiliate links at no extra cost to you.