
Photo: Wikipedia
Demographics of Chino Valley, AZ
Affluence Level in Chino Valley, AZ
A middle-class area roughly in line with national averages across income, home values, education, and employment.
People of Chino Valley, AZ
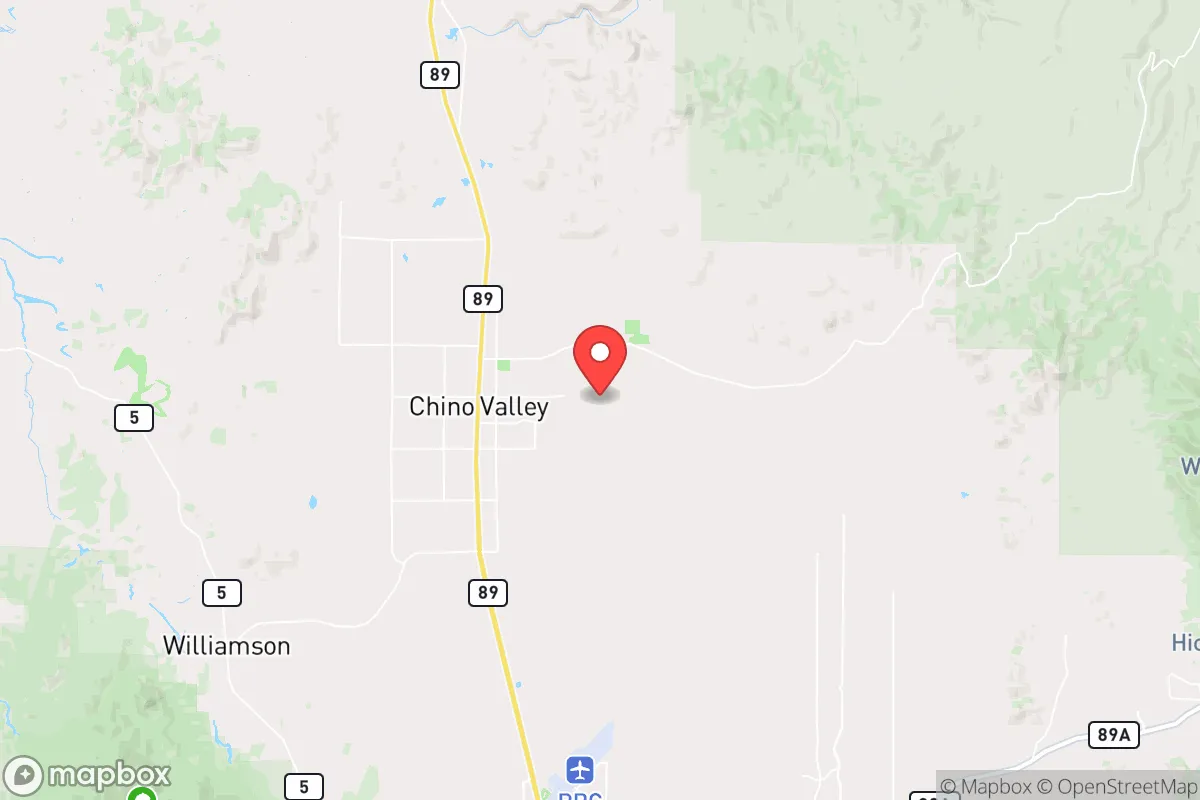
The people of Chino Valley, Arizona today number 13,372, forming a predominantly white (79.7%) and politically conservative community with a notably low foreign-born population of just 1.9%. The city is characterized by its rural character, strong family orientation, and a demographic profile that skews older and less college-educated (21.6%) than the national average, with a significant Hispanic minority (15.1%) that has deep local roots. Unlike many Arizona boomtowns, Chino Valley has maintained a slow-growth, small-town identity, with residents concentrated in established subdivisions like Del Rio and Mountain View Ranches, while newer arrivals gravitate toward Prescott Lakes Parkway corridor developments.
How the city was settled and grew
Chino Valley was settled later than many Arizona communities, with permanent Anglo-American homesteading beginning in the 1870s after the U.S. Army’s Fort Whipple was established nearby. The original settlers were primarily ranchers and farmers drawn by the fertile grasslands of the Chino Valley—a name derived from the Spanish word for “curly” or “crimped,” describing the native grama grass. These early families, largely of Northern European descent, built the first homes in what is now Old Town Chino Valley, centered around the intersection of Highway 89 and Road 1 South. The arrival of the Santa Fe, Prescott and Phoenix Railway in 1886 spurred a modest wave of merchants and tradesmen, but the town remained a ranching outpost through the early 20th century. A second, smaller wave of homesteaders arrived during the 1930s Dust Bowl, with some families settling in the Diamond Valley area to the north, where dryland farming and cattle grazing sustained them. By 1950, Chino Valley’s population was still under 1,000, and its character was overwhelmingly white, native-born, and tied to agriculture.
Modern era (post-1965)
The post-1965 period brought gradual change, driven not by immigration but by domestic in-migration from California and the Midwest. The 1970s and 1980s saw retirees and second-home buyers drawn by the mild climate and lower cost of living, settling in newer subdivisions like Mountain View Ranches and Del Rio, which offered acreage and a rural lifestyle. This wave was almost entirely white and native-born, reinforcing the city’s demographic homogeneity. The Hispanic population, which stands at 15.1% today, has deeper roots: many families trace back to Mexican-American ranch hands and farmworkers who arrived in the early 20th century, with later growth coming from natural increase rather than new immigration. These families are concentrated in the Old Town area and along Road 1 South, where older, more affordable housing stock exists. The Asian population is effectively zero (0.0% East/Southeast Asian, 0.2% Indian subcontinent), and the Black population is negligible at 0.7%, making Chino Valley one of the least ethnically diverse municipalities in Yavapai County. The city incorporated in 1970, partly to control growth and preserve its rural character, a decision that continues to shape development patterns.
The future
Chino Valley’s population is projected to grow slowly, reaching roughly 15,000–16,000 by 2035, driven primarily by domestic retirees and remote workers from more expensive Western states. The city is not homogenizing further—it is already extremely homogeneous—but it is likely to remain so. The Hispanic share may increase modestly through natural growth, but the foreign-born population is so low (1.9%) that significant diversification from immigration is unlikely. Newer subdivisions along the Prescott Lakes Parkway corridor and near Highway 89 are attracting younger families and some professionals, but these remain overwhelmingly white. The city’s low college attainment rate (21.6%) and limited high-wage employment mean that out-migration of young adults to Prescott or Phoenix may continue, further aging the population. No distinct ethnic enclaves are forming; instead, the city is consolidating as a predominantly white, conservative, rural-commuter community.
For a conservative-leaning individual or family moving to Chino Valley today, the city offers a stable, low-diversity environment with a strong sense of local identity and minimal demographic flux. The population is aging but not declining, and the slow growth means infrastructure and schools are not under the strain seen in faster-growing Arizona suburbs. The trade-off is limited cultural and economic diversity, with most new residents coming from similar backgrounds and seeking the same quiet, rural lifestyle that defined the city’s founding.
* Values derived from national, state, county, city and local statistics and may differ in a specific area. Last updated: 2026-05-01T06:03:36.000Z
Narrative content on this page is AI-generated and may contain mistakes. Verify any details that matter before acting on them.
ReloMaps may earn a commission from affiliate links at no extra cost to you.