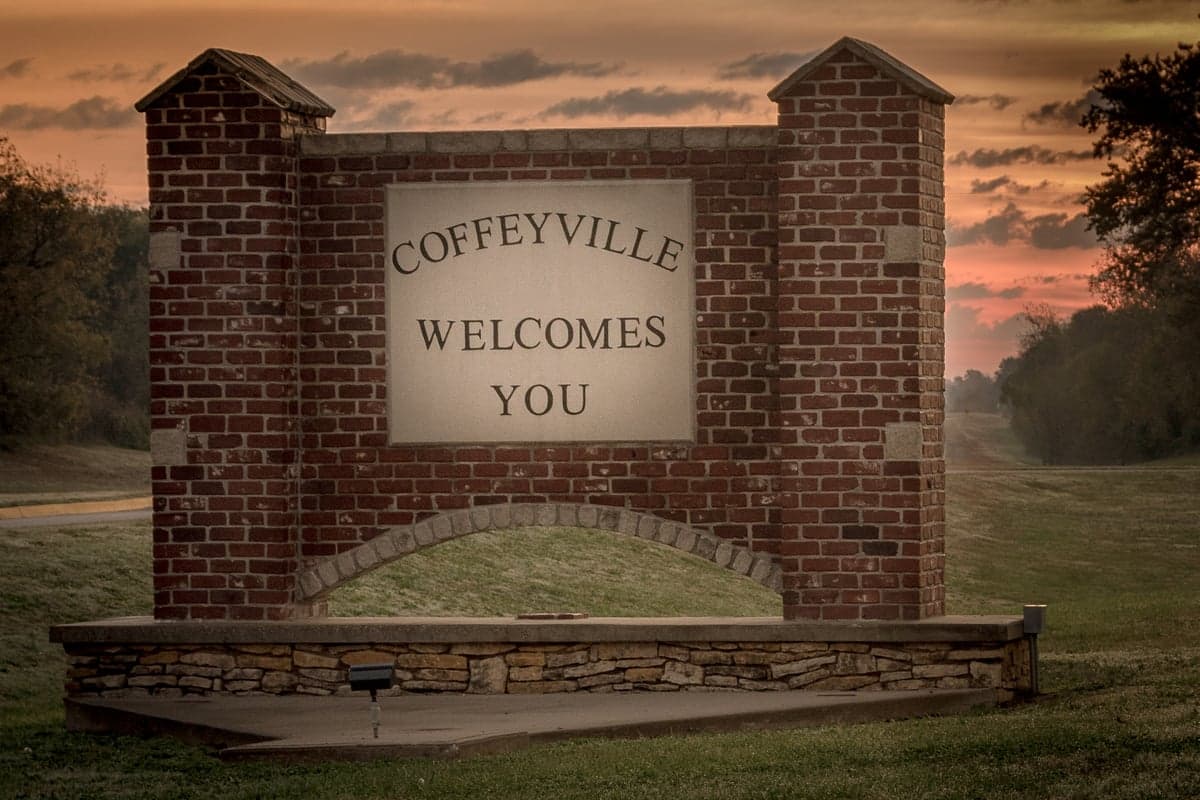
Photo: Wikipedia
Demographics of Coffeyville, KS
Affluence Level in Coffeyville, KS
A low-income area with significant economic hardship. Household wealth and educational attainment are well below national averages.
People of Coffeyville, KS
The people of Coffeyville, Kansas today form a small, predominantly working-class community of 8,752 residents, shaped by a history of industrial boom and demographic transition. The city is notably less diverse than the national average, with a White population of 62.7%, a significant Hispanic minority at 16.9%, and a Black population of 10.8%. With only 3.7% foreign-born and a low 14.5% college attainment rate, Coffeyville remains a place where native-born, blue-collar roots run deep, though its character is quietly shifting as younger generations leave and new Hispanic families arrive.
How the city was settled and grew
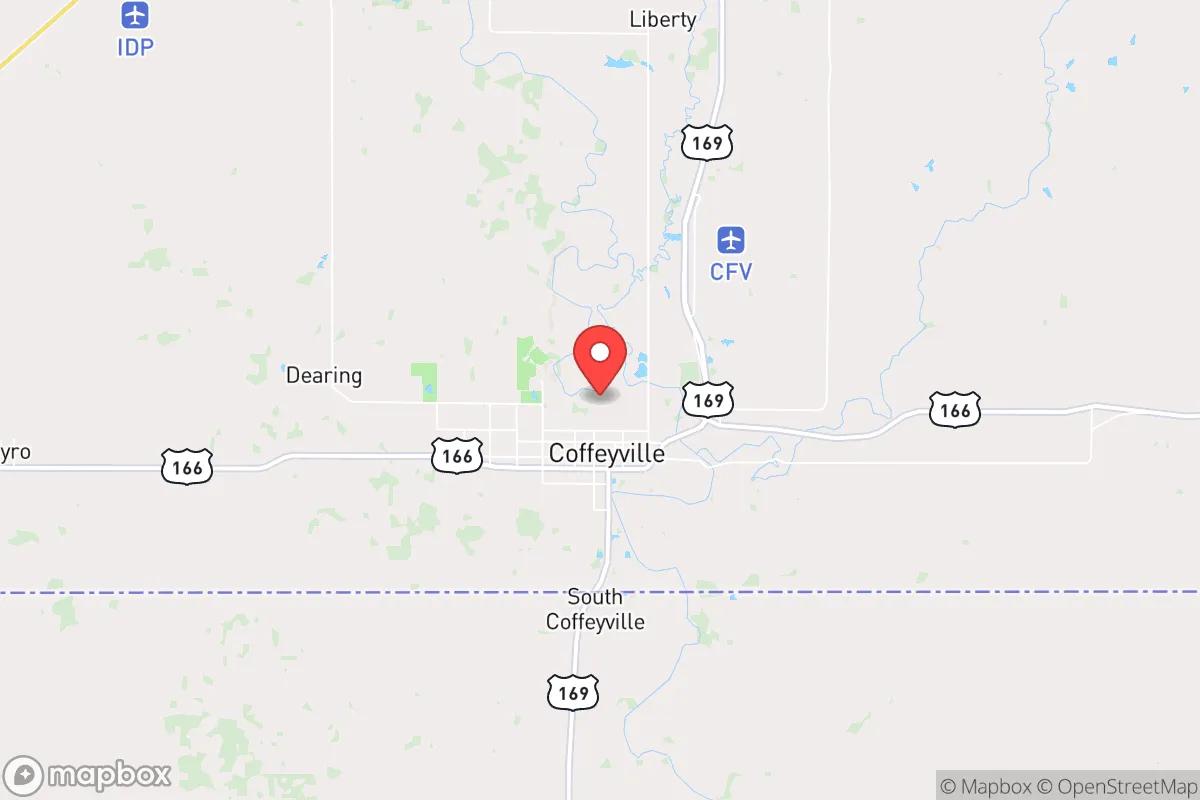
Coffeyville was founded in 1869 on the banks of the Verdigris River, its early growth driven by the railroad and the discovery of natural gas and oil in the surrounding region. The first wave of settlers were Anglo-American homesteaders and merchants, who built the original downtown core along Eighth Street and the residential blocks of North Coffeyville. By the early 1900s, the oil boom drew a second wave: Black families from the rural South seeking industrial jobs in the refineries and pipeline fields. These families established a distinct community in the South Coffeyville neighborhood, south of the railroad tracks, where churches, businesses, and a strong civic life took root. A smaller wave of German and Irish immigrants arrived to work in the brick and glass factories, settling in the West Side near the industrial corridor. The city peaked at over 18,000 residents in the 1960s, buoyed by the Acme Foundry and the Coffeyville Refinery, which anchored a stable, unionized workforce.
Modern era (post-1965)
After the 1965 Immigration Act, Coffeyville saw little direct immigration from Asia or the Indian subcontinent—the data shows 0.0% for both groups today. Instead, the major post-1965 demographic shift has been domestic: the departure of White and Black families as manufacturing jobs declined, and the gradual in-migration of Hispanic workers, primarily from Mexico and Texas, drawn to agricultural processing and remaining industrial jobs. These Hispanic families have concentrated in the East Side and the Sunset Strip area, where older housing stock and lower rents created an entry point. The Black population, which once made up roughly 15-18% of the city in the 1970s, has declined to 10.8%, with many families moving to larger Kansas cities like Wichita or Kansas City. The White population has fallen even more sharply, from over 80% in 1980 to 62.7% today, as younger Whites leave for college and urban job markets and are not replaced. The North Coffeyville neighborhood, once the city's most affluent, has seen significant depopulation and housing vacancies.
The future
Coffeyville's population is projected to continue a slow decline, with the 2020 census showing 8,752—down from 10,295 in 2010. The Hispanic share is the only segment growing, likely to reach 20-22% by 2035, driven by higher birth rates and continued labor migration. This growth is concentrating in the East Side and South Coffeyville, creating a more ethnically distinct enclave rather than a fully integrated city. The White and Black populations are both aging and shrinking, with few young families moving in. The city is not tribalizing into hostile camps, but it is quietly segregating by ethnicity and age: older White residents remain in North Coffeyville and the West Side, while younger Hispanic families fill the east and south. The 14.5% college attainment rate suggests little in-migration of educated professionals, meaning the city will likely remain a low-cost, blue-collar community with a growing Hispanic working class and a shrinking, older White base.
For a conservative-leaning individual or family considering a move, Coffeyville offers a low cost of living and a small-town, hands-on lifestyle, but the demographic reality is one of contraction and ethnic transition. The city is becoming more Hispanic and less White, with a stable Black minority, and the economic base is fragile. New arrivals will find a community that is neighborly but aging, where the schools and services are stretched thin by a declining tax base. It is a place for those who value quiet, affordability, and a slower pace—not for those seeking growth, diversity, or a dynamic job market.
* Values derived from national, state, county, city and local statistics and may differ in a specific area. Last updated: 2026-04-29T22:40:35.000Z
Narrative content on this page is AI-generated and may contain mistakes. Verify any details that matter before acting on them.
ReloMaps may earn a commission from affiliate links at no extra cost to you.