
Photo: Wikipedia
Demographics of College Station, TX
Historical data isn't available for College Station, TX. Trends shown are for Texas, Texas.
Affluence Level in College Station, TX
A middle-class area roughly in line with national averages across income, home values, education, and employment.
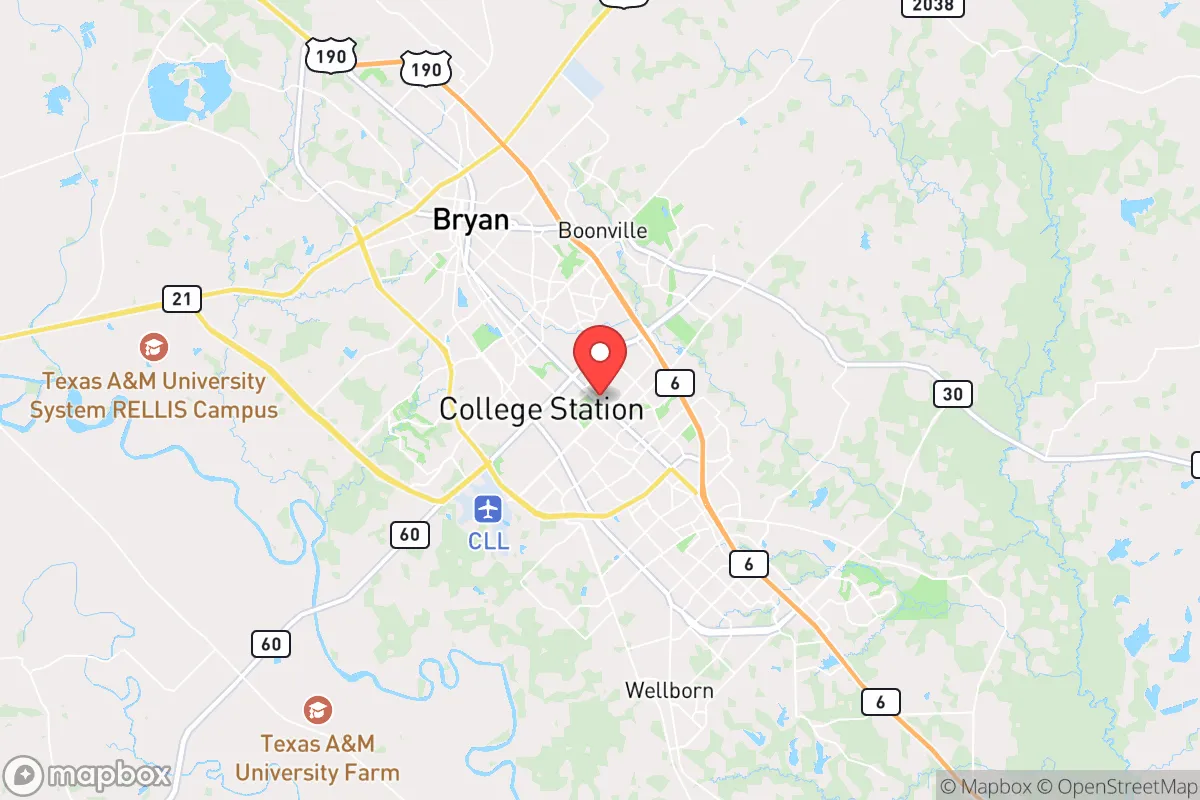
People of College Station, TX
College Station’s 122,280 residents form a young, highly educated, and politically conservative community anchored by Texas A&M University. The city is 60.5% white, 18.4% Hispanic, 8.1% Black, 5.7% East/Southeast Asian, and 3.8% Indian (subcontinent), with 57.1% holding a bachelor’s degree or higher. Its population is notably transient—students and young professionals cycle through every few years—yet a growing base of families and retirees is creating a more settled, suburban character. The city’s identity is a blend of Aggie tradition, evangelical Christianity, and a pragmatic, business-friendly conservatism that attracts both native Texans and out-of-state transplants seeking a safe, affordable, and family-oriented environment.
How the city was settled and grew
College Station was founded in 1876 as a railroad stop serving the newly established Agricultural and Mechanical College of Texas (now Texas A&M). Unlike older Texas towns, it has no antebellum or frontier history—its entire existence is tied to the university. The original population was overwhelmingly white, male, and rural, drawn by the land-grant mission to educate farmers and engineers. The first residential areas clustered around the campus: Northgate, the historic commercial district just north of campus, housed faculty and merchants, while Southside (south of University Drive) became a working-class neighborhood for railroad and service workers. Through the 1940s, the city remained small—fewer than 10,000 residents—and almost entirely white, with a tiny Black population concentrated in a segregated enclave near the railroad tracks (now part of the Eastgate area). The post-World War II GI Bill brought a surge of married veterans to campus, spurring the first suburban subdivisions: Castle Gate and Beverly Hills (built in the 1950s) filled with young faculty and returning soldiers, cementing the city’s middle-class, family-oriented character.
Modern era (post-1965)
The 1965 Hart-Cellar Act and the post-1960s expansion of Texas A&M transformed College Station’s demographics. The university’s recruitment of international graduate students, especially in engineering and the sciences, brought the first significant non-white populations. East/Southeast Asian immigrants—primarily Chinese, Korean, and Vietnamese—settled near campus in the University Oaks and Holleman Drive corridors, where rental apartments and townhomes catered to graduate students and visiting scholars. Indian (subcontinent) families, arriving in larger numbers after 1990, concentrated in newer subdivisions like Southwood Valley and Woodcreek, drawn by good schools and proximity to the university’s engineering and medical programs. Hispanic growth accelerated after 2000, driven by both domestic migration from South Texas and immigration from Mexico and Central America; many settled in the Eastgate and Briarcrest areas, where older, more affordable housing stock exists. The Black population, historically small, grew modestly through the 1990s and 2000s, with many families choosing Southwest Parkway subdivisions for newer homes and better schools. White flight from older neighborhoods like Northgate and Southside accelerated as those areas became student-dominated; white families with children increasingly moved to the far west and south sides—Wellborn, Rock Prairie, and Peach Creek—creating a ring of newer, largely white subdivisions.
The future
College Station’s population is heading toward greater diversity but also greater spatial segregation by income and ethnicity. The Hispanic share (18.4%) is growing fastest, driven by both natural increase and continued migration from the Rio Grande Valley and Mexico; this community is likely to reach 25-30% of the population by 2040, with a growing middle class moving into subdivisions like Briarcrest and Southwood Valley. The East/Southeast Asian and Indian populations are plateauing as the university’s international enrollment stabilizes; these groups are highly assimilated, with second-generation children attending Texas A&M and entering professional careers. The white population, while still a majority, is aging and suburbanizing—young white families continue to move to the outer ring (Wellborn, Peach Creek), while the urban core (Northgate, Southside) becomes increasingly student and renter-dominated. The city is not tribalizing into hostile enclaves, but distinct neighborhoods are emerging: Eastgate as a Hispanic-majority working-class area, University Oaks as an Asian-majority student zone, and the far west as a white, affluent family corridor. The biggest wildcard is Texas A&M’s enrollment growth—if the university continues expanding, the city will remain young and transient; if it plateaus, College Station will age and become more family-oriented.
For a conservative-leaning mover today, College Station offers a stable, safe, and increasingly diverse community where traditional values (church, family, patriotism) remain strong, but the demographic texture is shifting. The city is becoming less uniformly white and more Hispanic and Asian, yet these groups largely share the same conservative political and cultural outlook—support for low taxes, school choice, and Second Amendment rights. The key decision is neighborhood: families will find the best schools and newest homes in the west and south rings, while singles and empty-nesters may prefer the older, walkable areas near campus. The bottom line: College Station is a growing, moderately diverse Sun Belt city that is absorbing demographic change without losing its conservative character—a good fit for those who want a safe, affordable, and culturally traditional environment with a cosmopolitan edge from the university.
* Values derived from national, state, county, city and local statistics and may differ in a specific area. Last updated: 2026-04-21T12:55:54.000Z
Narrative content on this page is AI-generated and may contain mistakes. Verify any details that matter before acting on them.
ReloMaps may earn a commission from affiliate links at no extra cost to you.