Photo: Wikipedia
Demographics of Corpus Christi, TX
Affluence Level in Corpus Christi, TX
A below-average socioeconomic profile. Incomes, home values, and educational attainment trail the U.S., with higher poverty and unemployment.
People of Corpus Christi, TX
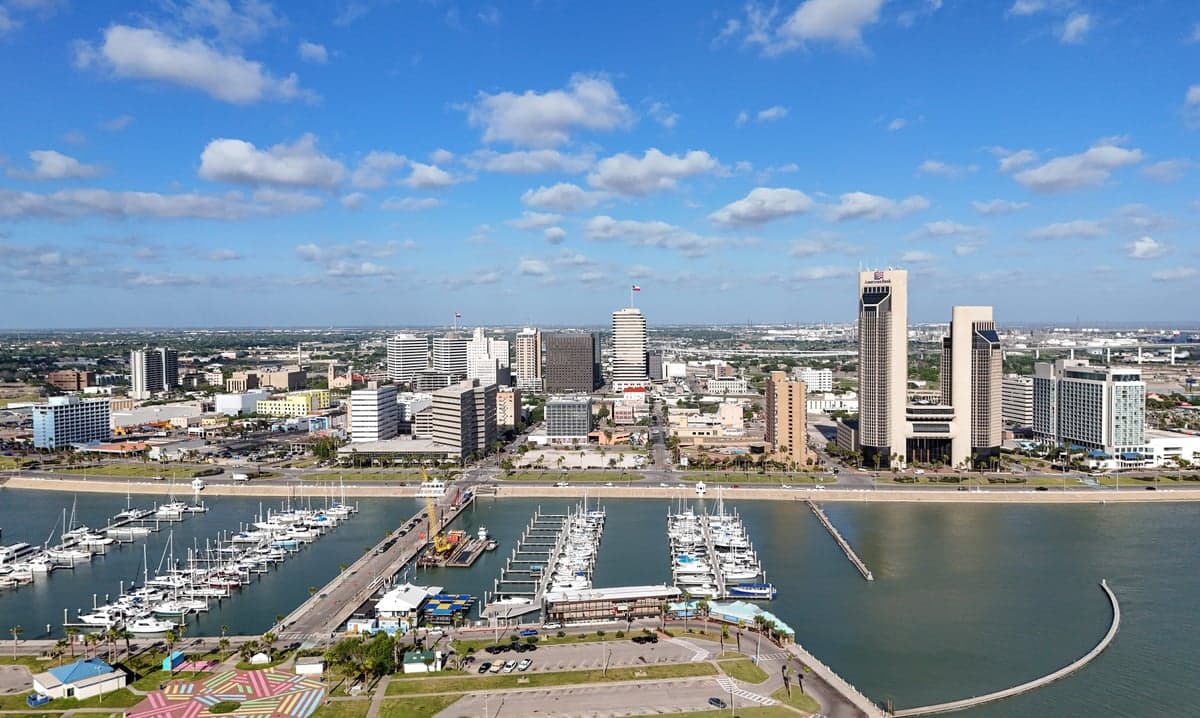
The people of Corpus Christi, Texas, form a majority-Hispanic city of 317,383 residents, where 61.4% identify as Hispanic or Latino, 30.1% as non-Hispanic white, 4.0% as Black, 1.8% as East or Southeast Asian, and 0.7% as Indian (subcontinent). The city’s identity is shaped by its deep Mexican-American roots, a strong military and port economy, and a relatively low foreign-born share of 5.2%—indicating a population that is largely native-born and multigenerational. Corpus Christi is denser than many Texas cities of similar size, with a compact urban core along the bay, and its residents are notably less college-educated (24.3%) than the state average, reflecting a blue-collar and service-oriented workforce tied to the Port of Corpus Christi, the petrochemical industry, and Naval Air Station Corpus Christi.
How the city was settled and grew
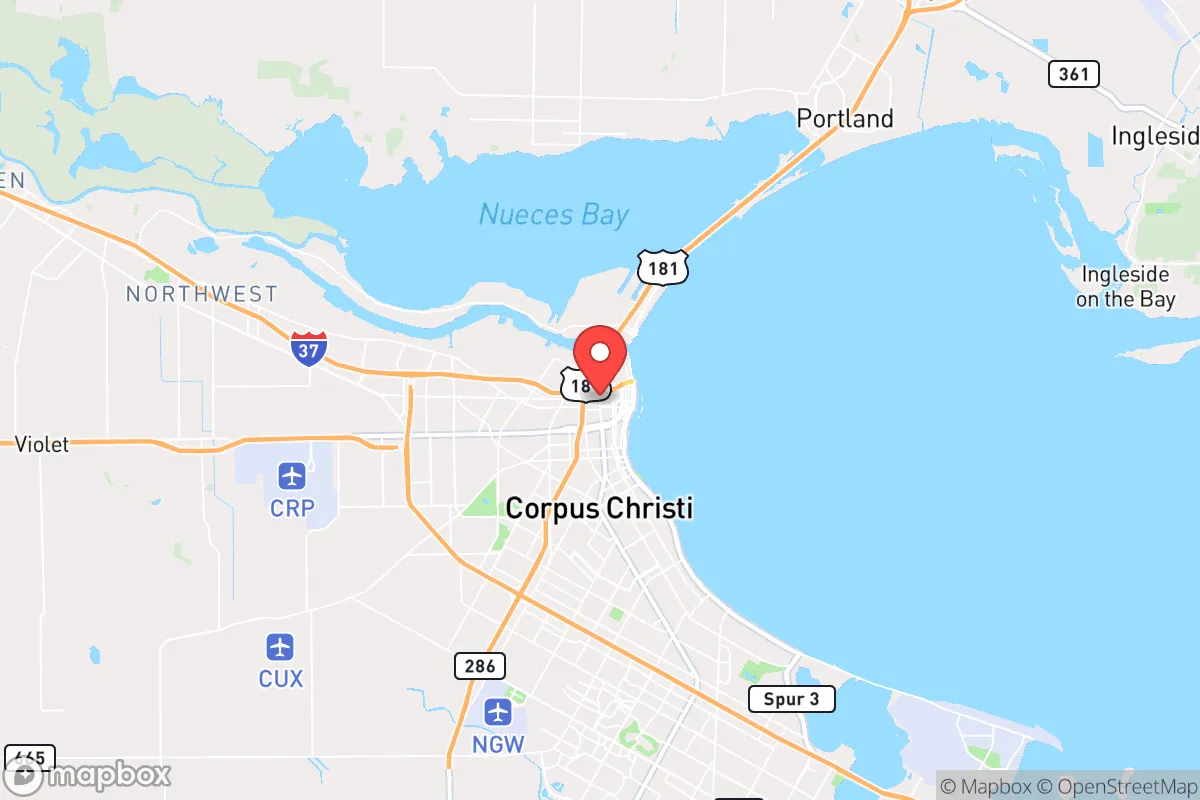
Corpus Christi’s population history begins not with Spanish missions but with a mid-19th-century trading post founded by Henry Kinney in 1839. The city’s deep-water port and proximity to the Mexican border drew a mix of Anglo-American merchants, Mexican ranchers, and German immigrants. The original Anglo settlers clustered around the downtown waterfront, now the Northside and Central City neighborhoods, while Mexican laborers and vaqueros settled in what became the Hillcrest and Dona Park areas south of the downtown core. By the early 1900s, the arrival of the railroad and the development of the Port of Corpus Christi (opened 1926) spurred a second wave: Midwestern farmers and oil workers moved in during the 1930s-1950s, settling in the Bay Area and Southside neighborhoods. The city’s Hispanic population grew steadily through natural increase and cross-border migration, but remained largely segregated in the Westside barrios, such as Molina and La Retama, where Mexican-American families built tight-knit communities around Catholic parishes and small businesses.
Modern era (post-1965)
After the 1965 Hart-Cellar Act, Corpus Christi saw a modest uptick in foreign-born residents, but the city’s demographic story since 1965 is primarily one of domestic in-migration and suburbanization. The Hispanic share rose from roughly 40% in 1970 to over 60% today, driven by higher birth rates and continued migration from the Rio Grande Valley and northern Mexico. These newer arrivals often settled in the Westside and Southside subdivisions, such as Calallen and London, where affordable housing and new schools attracted young families. Meanwhile, the non-Hispanic white population, which dominated the Bay Area and Flour Bluff neighborhoods near the naval air station, has aged and declined in share. The Black population (4.0%) remains concentrated in the Northside and Washington-Coles area, a legacy of mid-century migration for shipyard and refinery jobs. The East/Southeast Asian community (1.8%) is small but visible in the Southside medical district, tied to healthcare and university employment, while the Indian-subcontinent population (0.7%) is even smaller, with families scattered across the Bay Area and Southside. The foreign-born share (5.2%) is low for a Texas coastal city, indicating that most Hispanic growth is native-born and English-dominant.
The future
Corpus Christi’s population is heading toward a more homogenized Hispanic-majority identity, with the non-Hispanic white share projected to fall below 25% by 2040. The city is not tribalizing into distinct ethnic enclaves; rather, Hispanic residents are spreading across all neighborhoods, including formerly white-dominated Flour Bluff and Bay Area, while the small Black and Asian communities remain stable but not growing. The immigrant population is plateauing—the foreign-born share has barely budged since 2000—and assimilation is high, with most second- and third-generation Hispanic residents speaking English as a primary language. The biggest demographic wildcard is the Port of Corpus Christi’s expansion as a crude oil export hub, which could attract a new wave of workers from the Gulf Coast and Midwest, potentially stabilizing the white and Black shares. For a newcomer, the city offers a culturally cohesive, family-oriented environment where the Hispanic heritage is mainstream, not marginal, and where the low cost of living and military presence create a stable, blue-collar social fabric.
Corpus Christi is becoming a solidly Hispanic, native-born, and working-class city—a place where the old Anglo and Mexican divides are fading into a single, blended identity centered on the bay, the port, and the base. For a conservative-leaning mover, this means a community with strong family ties, traditional values, and a slow-growth, affordable housing market, but also limited ethnic diversity and a lower share of college-educated peers than in Texas’s booming metros.
* Values derived from national, state, county, city and local statistics and may differ in a specific area. Last updated: 2026-04-14T20:11:02.000Z
Narrative content on this page is AI-generated and may contain mistakes. Verify any details that matter before acting on them.
ReloMaps may earn a commission from affiliate links at no extra cost to you.