


Photo: Wikipedia
Quality of Life in Danbury, CT
A high quality of life with strong walkability, manageable living costs, healthy neighborhood signals, and solid amenity access.
What does Quality of Life tell us?
Quality of Life blends cost of living, nearby amenities, socioeconomic signals, and neighborhood character. City-level scores represent the whole municipality; individual neighborhoods can differ.
What does this tell us?
Quality of Life blends cost of living, nearby amenities, socioeconomic signals, and neighborhood character. City-level scores represent the whole municipality; individual neighborhoods can differ.
Cost of Living
47% above national average
The Real Cost of Living in Danbury, CT for 2026
| Tier | Individual | Family (4) |
|---|---|---|
| Survival | $29k | $54k |
| Comfortable | $74k | $109k |
| Luxury | $151k+ | $234k+ |
| Elite (Top 5%) | $184k+ | $284k+ |
77%
The Area Signal
A metric tracking the socioeconomic signals of the area.
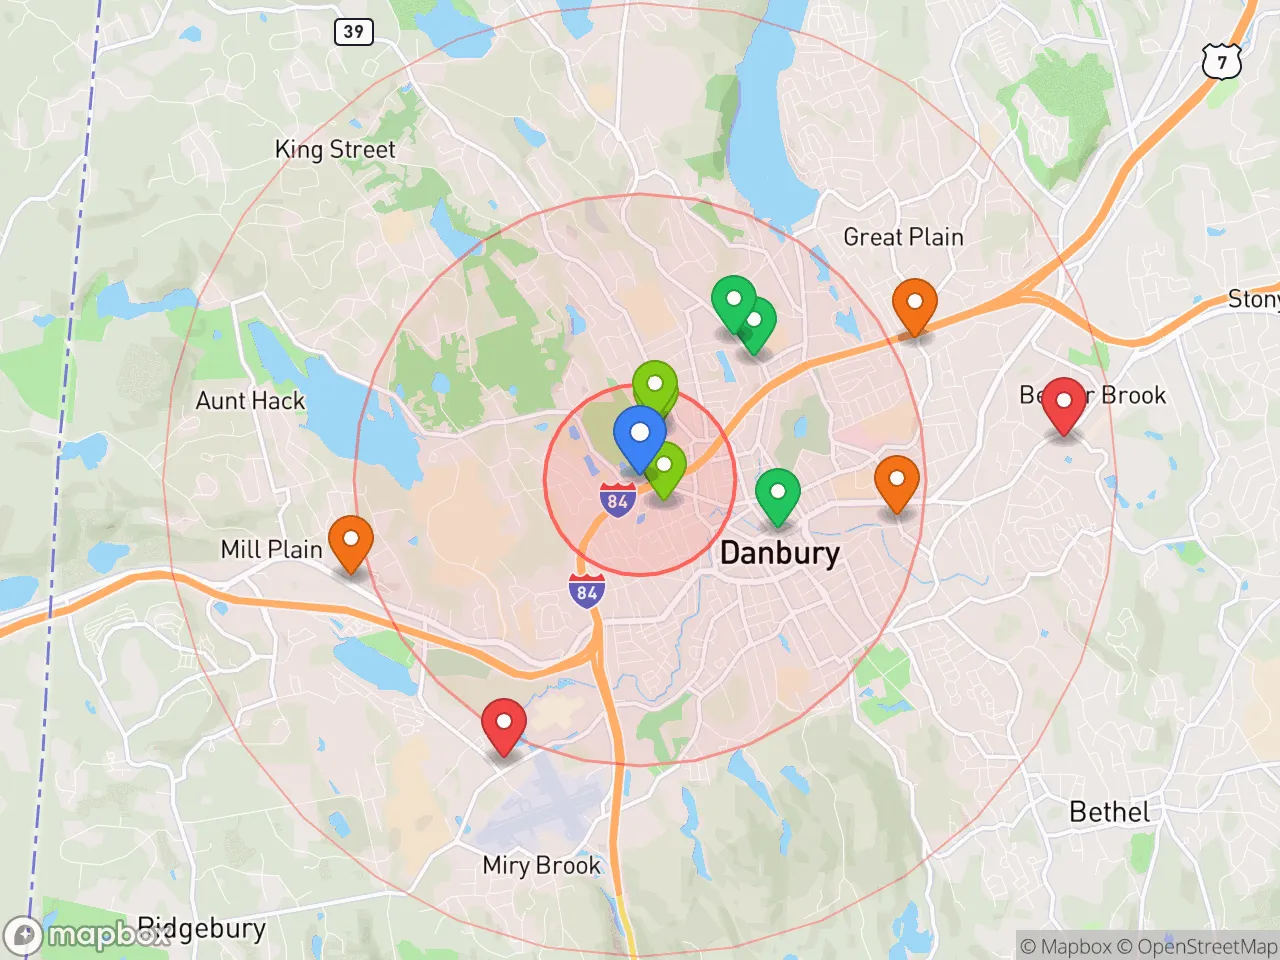
Hobbies
Explore the areaGroceries
9 within 10 miles
Gas
20 within 10 miles
Hospital
8 within 20 miles
Airport
JFK — John F. Kennedy International
Post Office
USPS — Danbury, CT
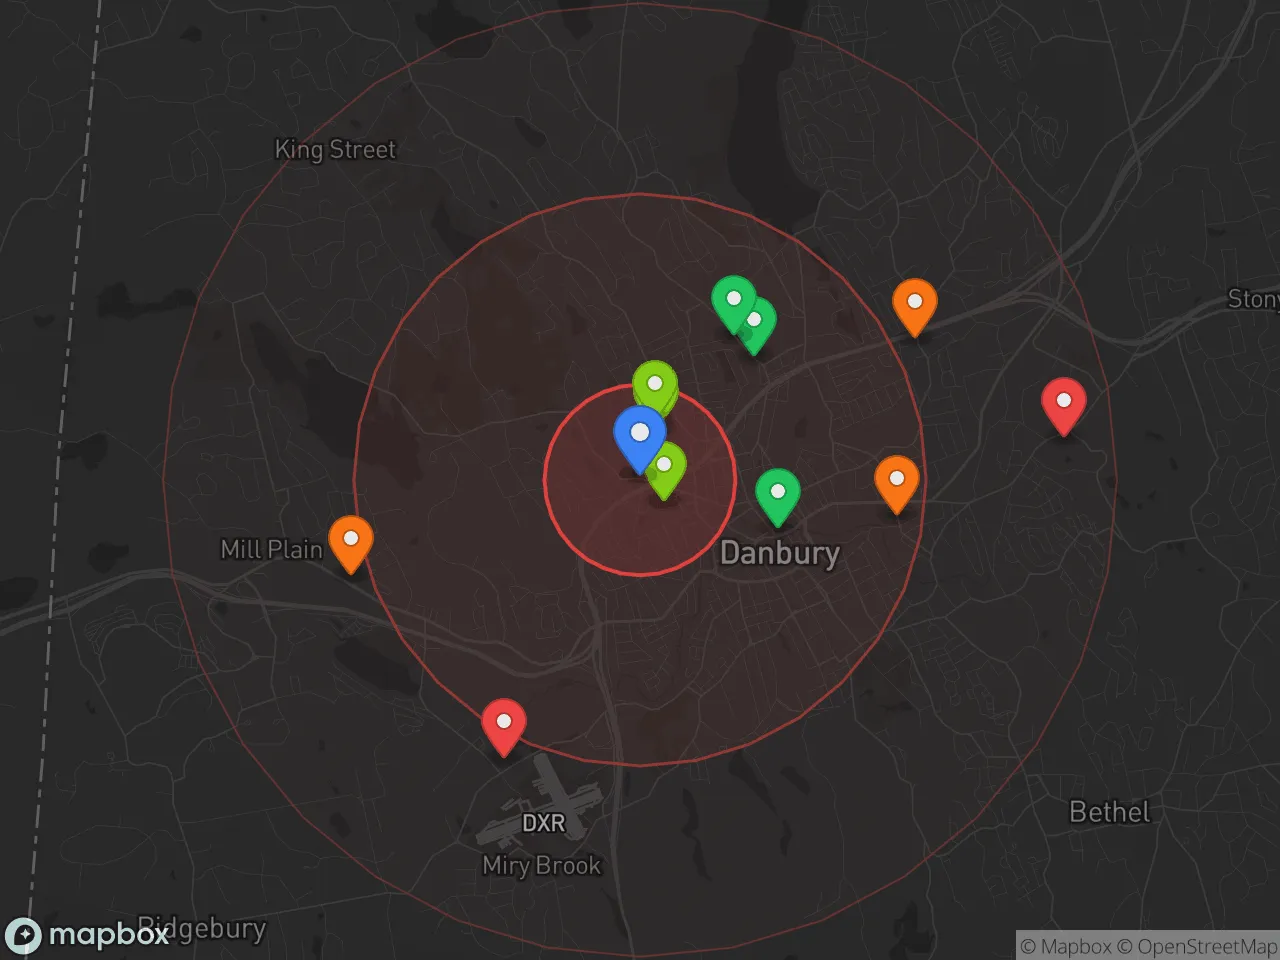
Critical Amenities
Quality-of-Life Analysis
Danbury, Connecticut, presents a quality-of-life profile defined by its position as a relatively affluent suburban hub where the cost of living index of 147 (well above the U.S. average of 100) reflects its proximity to New York City and its role as a regional employment center. The city attracts a mix of professionals commuting to Fairfield County and Westchester County, along with families and long-term residents who value its blend of urban amenities and suburban space. With a median home value of $381,600 and a median rent of $1,804, Danbury offers a more attainable entry point than neighboring towns like Ridgefield or New Canaan, though it remains significantly pricier than the national norm.
Cost of living, housing, and affordability compared to nearby areas
Danbury’s cost of living is driven primarily by housing and transportation, though it remains a relative bargain within Fairfield County. The median home value of $381,600 is roughly 30% lower than the county median of about $540,000, making it one of the more accessible markets for buyers seeking proximity to New York City. The median rent of $1,804 is similarly below the county average of roughly $2,100, though it still represents a significant monthly outlay. The average commute time of 31.2 minutes aligns closely with the national average, but many residents face longer drives or train rides into Manhattan, which adds to transportation costs. Compared to Danbury, nearby Bethel and Brookfield offer slightly lower home prices but fewer job centers, while Ridgefield and Wilton command premiums of 50% or more for similar square footage. Property taxes in Danbury are moderate by Connecticut standards—roughly 2.2% of assessed value—which is lower than in many neighboring towns but still a meaningful factor in monthly carrying costs.
What daily life is like for families: schools, amenities, and recreation
Daily life in Danbury centers on a mix of suburban convenience and small-city energy. The Danbury Public Schools system serves roughly 11,000 students, with Danbury High School offering a wide range of Advanced Placement courses and a strong music program; the district also includes alternative magnet schools like the Danbury Academy. For families, the city’s over 1,200 acres of parkland—including Tarrywile Park with its hiking trails and gardens, and Candlewood Lake for boating and fishing—provide ample outdoor recreation. The Danbury Fair Mall anchors retail activity, while the downtown area has seen revitalization with new restaurants, breweries, and the Palace Danbury theater. Commuters rely on the Danbury Branch of Metro-North Railroad, which connects to Grand Central Terminal in about 90 minutes, though many drive to nearby Stamford or White Plains for shorter rail options. The city also hosts Western Connecticut State University, adding a collegiate presence that supports cultural events and part-time job opportunities for residents.
Danbury is best suited for professionals and families who want access to New York City’s job market without paying Fairfield County’s highest housing premiums. The city works well for those who value a walkable downtown, strong public schools, and a calendar of community events like the Danbury Farmers’ Market and the Portuguese Cultural Center’s festivals. Retirees on fixed incomes may find the cost of living challenging, but dual-income households earning above the regional median of roughly $85,000 can manage comfortably. Ultimately, Danbury offers a pragmatic trade-off: higher costs than the national average, but significantly lower than its wealthier neighbors, paired with a robust set of amenities that make daily life feel both connected and self-contained.
Crime in Danbury, CT
Lower crime rates than 75% of comparable U.S. locations.
Violent CrimeViolent Crime Analysis
Property CrimeProperty Crime Analysis
Crime Analysis
Danbury, Connecticut, reports a violent crime rate of 138.8 incidents per 100,000 residents and a property crime rate of 1,053.1 per 100,000, placing it in a middle tier for safety among Connecticut cities. While these figures are lower than those of nearby Bridgeport or New Haven, the city’s proximity to the New York metro area introduces regional crime pressures that residents should weigh carefully. The overall safety picture is mixed: property crime is a more frequent concern than violent offenses, but the local justice system’s ideological leanings raise additional considerations for those evaluating long-term risk.
Crime in context
Danbury’s violent crime rate of 138.8 per 100,000 is roughly 60% lower than the national average of about 370 per 100,000, and its property crime rate of 1,053.1 per 100,000 sits about 25% below the U.S. median of roughly 1,400 per 100,000. Compared to Connecticut’s statewide violent crime rate of approximately 200 per 100,000, Danbury is safer than the state average. However, property crime in Danbury is slightly above the Connecticut average of roughly 950 per 100,000, driven largely by larceny and vehicle break-ins. These numbers reflect a city that is statistically safer than many urban centers but still experiences crime patterns typical of a densely populated suburban hub near a major metro area.
What residents experience
Residents most commonly encounter property crimes such as package theft, car break-ins, and occasional burglaries, particularly in commercial corridors like Newtown Road and the Danbury Fair Mall area. Violent crime is rare but not absent, with incidents concentrated in specific neighborhoods rather than citywide. A significant concern for Danbury is the influence of progressive judicial policies in Connecticut’s court system. Fairfield County’s district attorneys and judges have increasingly adopted bail reform and diversion programs that prioritize reducing incarceration over public safety. This approach, while intended to address systemic inequities, has resulted in repeat offenders cycling through the system with minimal consequences. For residents, this means that individuals arrested for property crimes or low-level offenses are often released quickly, contributing to a sense of impunity among habitual criminals and undermining deterrence.
Neighborhood-level variation is notable in Danbury. Areas west of Interstate 84, including the downtown core and the Beaver Street corridor, see higher concentrations of both property and violent crime. In contrast, residential neighborhoods like Miry Brook and the Mill Ridge area report significantly lower incident rates, often comparable to suburban towns like Ridgefield or Bethel. Prospective residents should prioritize neighborhoods with strong community watch programs and private security presence, as these factors correlate with lower crime incidence. Overall, Danbury offers a moderate safety profile, but the combination of metro-area crime spillover and a lenient local justice system warrants cautious evaluation for families and long-term homeowners.
* Values derived from national, state, county, city and local statistics and may differ in a specific area. Last updated: 2026-04-30T01:30:52.000Z
Narrative content on this page is AI-generated and may contain mistakes. Verify any details that matter before acting on them.
ReloMaps may earn a commission from affiliate links at no extra cost to you.