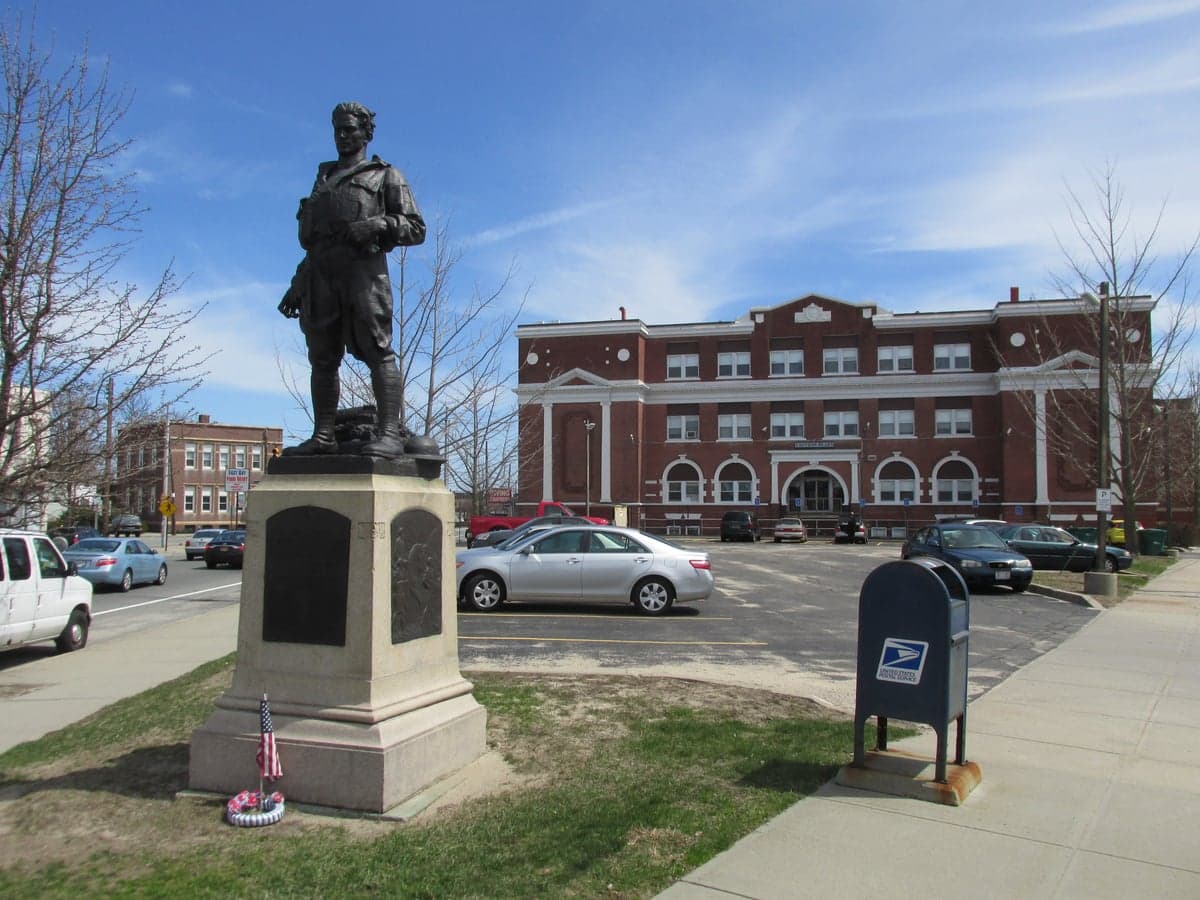
Photo: Wikipedia
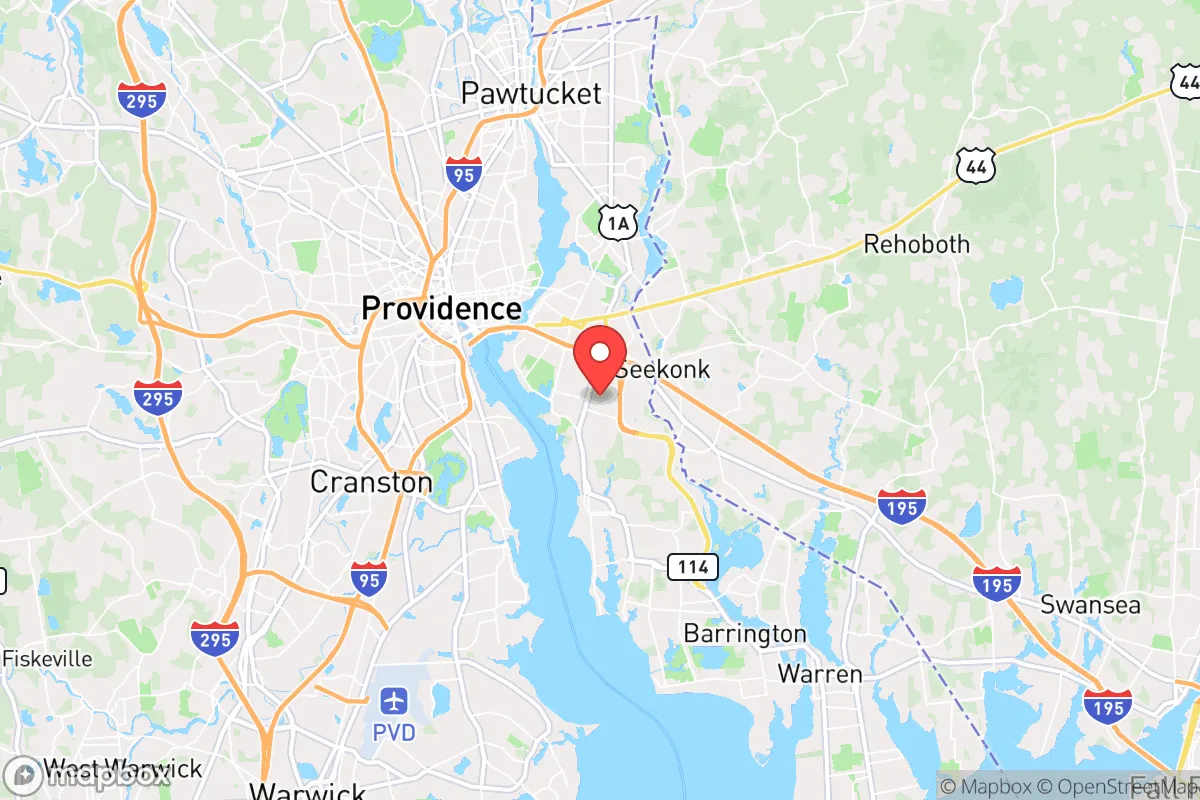
Demographics of East Providence, RI
Affluence Level in East Providence, RI
A middle-class area roughly in line with national averages across income, home values, education, and employment.
People of East Providence, RI
The people of East Providence, Rhode Island, today number 46,970, forming a densely settled, historically rooted community that is notably more white (74.4%) and less foreign-born (6.5%) than neighboring Providence. The city retains a distinct working-to-middle-class character, with a 32.3% college-educated rate that trails the state average, and a modest but growing Hispanic (8.9%) and Black (5.4%) presence. Its identity is shaped by a legacy of Portuguese, Irish, and French-Canadian immigration, layered with newer enclaves of East/Southeast Asian (1.6%) and Indian-subcontinent (1.0%) residents, creating a quiet, family-oriented suburb with a strong sense of neighborhood identity.
How the city was settled and grew
East Providence was originally part of the Plymouth Colony, settled in the 1630s by English farmers drawn to the fertile land along the Seekonk River. The area remained rural through the 18th century, but the 19th-century Industrial Revolution transformed it. The Blackstone River's water power and the arrival of the Providence and Worcester Railroad in the 1840s spurred mill construction, drawing waves of immigrants. Irish laborers built the railroad and worked in the mills, settling in the Phillipsdale and Riverside neighborhoods along the river. French-Canadians followed in the 1870s-1890s, fleeing Quebec's agricultural depression, and concentrated in Rumford and Kent Heights, where they built the St. Jean Baptiste parish. Portuguese immigrants, primarily from the Azores, arrived in the early 1900s, finding work in the Rumford Chemical Works and the textile mills; they established a strong presence in Watchemoket Square and Pawtucket Avenue corridors. By 1920, East Providence's population had swelled to over 20,000, a mix of Yankee Protestants and Catholic immigrants, with the city formally incorporating in 1862.
Modern era (post-1965)
The 1965 Hart-Cellar Act and the decline of manufacturing reshaped East Providence's demographics. The city's mills began closing in the 1970s, and the white ethnic population—Irish, French-Canadian, Portuguese—began aging in place or moving to outer suburbs like Seekonk and Rehoboth. Hispanic migration, primarily Puerto Rican and Dominican, accelerated after 1990, with families settling in the Pawtucket Avenue corridor and the Phillipsdale area, drawn by affordable housing stock and proximity to Providence's service jobs. The Black population, historically small, grew from 2.1% in 2000 to 5.4% today, with many families arriving from other parts of Rhode Island and settling in Riverside and the East Providence Center district. East/Southeast Asian communities—primarily Vietnamese and Cambodian—arrived in the 1980s and 1990s as refugees, establishing small clusters in Rumford and near the Taunton Avenue commercial strip. The Indian-subcontinent population (1.0%) is a more recent arrival, largely professionals working in Providence's hospitals and Brown University, concentrated in the Rumford and Kent Heights neighborhoods. The foreign-born share (6.5%) is half the state average, reflecting the city's role as a second-stage suburb rather than a primary immigrant gateway.
The future
East Providence's population is slowly diversifying but remains predominantly white and native-born. The Hispanic share (8.9%) is projected to grow to 12-14% by 2040, driven by natural increase and continued migration from Providence, while the Black and Asian shares are likely to plateau as housing costs rise. The city is not tribalizing into distinct ethnic enclaves—most neighborhoods remain mixed, with the exception of the Watchemoket Square area, which retains a strong Portuguese character. The biggest demographic shift is generational: the 65+ population now exceeds 18%, and younger families are being priced out by Providence spillover, with median home values rising 45% since 2020. The city is becoming more college-educated (32.3%) as professionals seek affordable alternatives to Providence and Barrington, but the school system's mixed performance may slow this trend. The Indian and East/Southeast Asian communities are small and assimilating rapidly, with second-generation residents often moving to larger job markets.
For a conservative-leaning mover, East Providence offers a stable, family-oriented environment with a strong sense of neighborhood identity, but it is not a high-growth or rapidly diversifying city. The population is aging, and the city's future depends on retaining younger families and managing the tension between its historic working-class roots and rising property values. It is becoming a quieter, more expensive version of its former self—a place where the past still shapes daily life more than the future.
* Values derived from national, state, county, city and local statistics and may differ in a specific area. Last updated: 2026-04-22T04:57:26.000Z
Narrative content on this page is AI-generated and may contain mistakes. Verify any details that matter before acting on them.
ReloMaps may earn a commission from affiliate links at no extra cost to you.