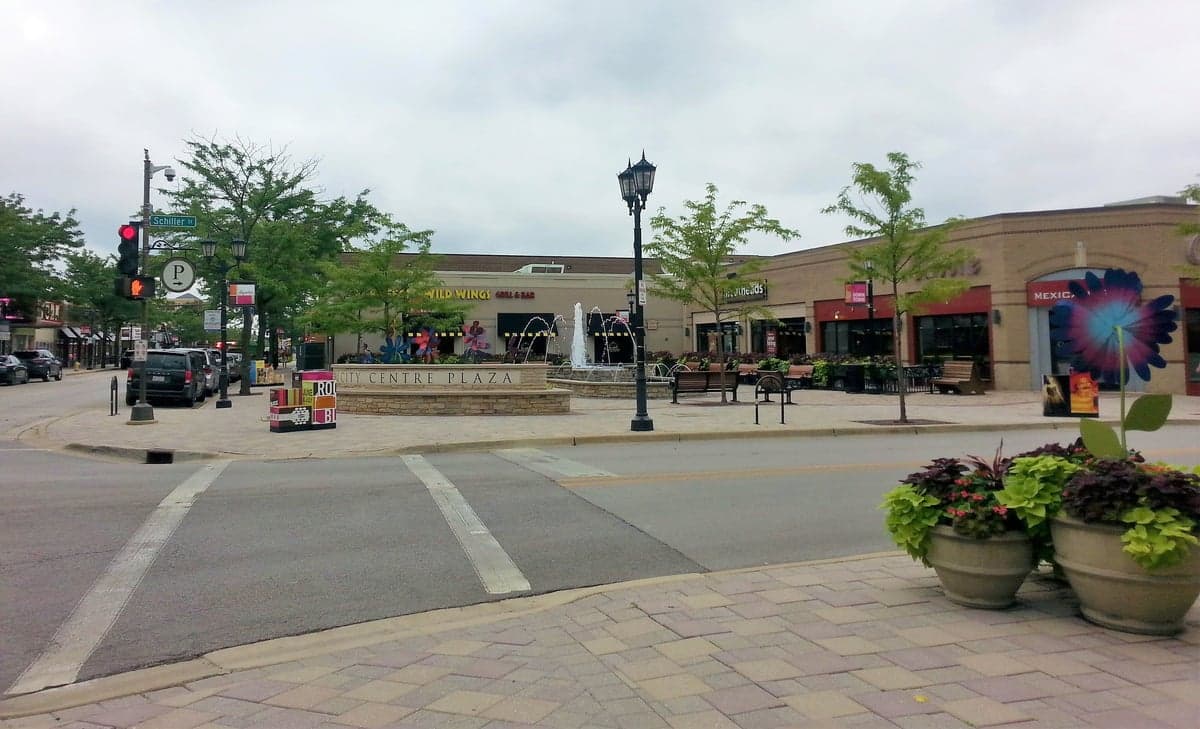
Photo: Wikipedia
Demographics of Elmhurst, IL
Affluence Level in Elmhurst, IL
An upper-middle-class area. Household wealth, education levels, and homeownership run ahead of national benchmarks.
People of Elmhurst, IL
Elmhurst, Illinois, is a city of 45,538 residents that blends a historic, family-oriented character with a highly educated, professional workforce. The population is predominantly white (77.6%) but has seen measurable growth in Hispanic (10.1%) and Indian-subcontinent (4.0%) communities, while remaining notably less diverse than nearby Chicago. With 63.0% of adults holding a college degree and a foreign-born share of just 2.6%, Elmhurst is a stable, affluent suburb where generational continuity and new professional arrivals coexist.
How the city was settled and grew
Elmhurst’s human history begins with its founding in the 1840s as a farming settlement along the Galena & Chicago Union Railroad. The original population was almost entirely of German and English stock, drawn by cheap prairie land and the promise of rail access to Chicago’s markets. The village incorporated in 1882, and by the early 20th century, a wave of Swedish immigrants arrived, settling primarily in the South Elmhurst neighborhood around York Road and St. Charles Road, where they built the Swedish Evangelical Lutheran Church (now Elmhurst Presbyterian). The city’s first major growth spurt came in the 1920s and 1930s, when the Elmhurst Country Club area and the Bryant Manor subdivision attracted middle-class Chicagoans seeking larger lots and newer homes. These early residents were overwhelmingly white, Protestant, and employed in Chicago’s manufacturing and railroad sectors. The post-World War II boom accelerated this pattern: the Wildwood and Spring Road neighborhoods filled with returning GIs and their families, many of Italian and Polish Catholic heritage, who built the city’s first large subdivisions. By 1960, Elmhurst was a nearly all-white, middle-class bedroom community of about 36,000 people.
Modern era (post-1965)
The 1965 Hart-Cellar Act had a muted effect on Elmhurst compared to Chicago proper. The city’s housing stock—mostly single-family homes with high price points—limited the arrival of new immigrant groups until the 1990s. The most significant post-1965 shift has been the growth of the Hispanic population, concentrated in the North Elmhurst area near North Avenue and the Berkeley Park district, where older, smaller homes and some multi-unit buildings offered more affordable entry points. This community, largely of Mexican and Central American origin, now makes up 10.1% of the population. A more recent and economically distinct wave is the Indian-subcontinent community, which has grown to 4.0% of residents. These families have settled primarily in the College View and East Elmhurst neighborhoods near Elmhurst College and the Metra station, drawn by the city’s top-rated public schools and proximity to tech and professional jobs in Chicago and the western suburbs. East/Southeast Asian residents (2.6%) are a smaller but stable presence, with clusters near the Yorkfield area. The Black population remains very small at 1.8%, with no single neighborhood concentration, reflecting Elmhurst’s persistent racial homogeneity despite suburban integration trends elsewhere.
The future
Elmhurst’s population is heading toward modest diversification, but the pace is slow. The white share has declined from roughly 90% in 1990 to 77.6% today, driven almost entirely by the growth of Hispanic and Indian-subcontinent households. The Hispanic community is growing steadily through both in-migration and natural increase, and is likely to reach 12-14% of the population by 2035. The Indian-subcontinent community, while smaller, is growing faster in percentage terms as professionals from the western suburbs seek Elmhurst’s school district and housing stock. The East/Southeast Asian population appears plateaued, and the Black population shows no signs of significant growth. The city is not tribalizing into distinct enclaves—most neighborhoods remain majority white—but North Elmhurst is becoming a recognizable Hispanic corridor, and College View is emerging as a professional Indian-subcontinent cluster. The overall trend is toward a more diverse, but still predominantly white and highly educated, suburb.
For someone moving in now, Elmhurst is a stable, low-turnover community where new residents—especially families—are welcomed but will find a population that is older, whiter, and more established than in many western suburbs. The city’s demographic future is one of gradual, professional-class diversification, not rapid change. It remains a place where generational roots run deep, and where newcomers are most likely to be other professionals seeking the same schools and safety that drew earlier waves.
* Values derived from national, state, county, city and local statistics and may differ in a specific area. Last updated: 2026-04-29T19:15:29.000Z
Narrative content on this page is AI-generated and may contain mistakes. Verify any details that matter before acting on them.
ReloMaps may earn a commission from affiliate links at no extra cost to you.