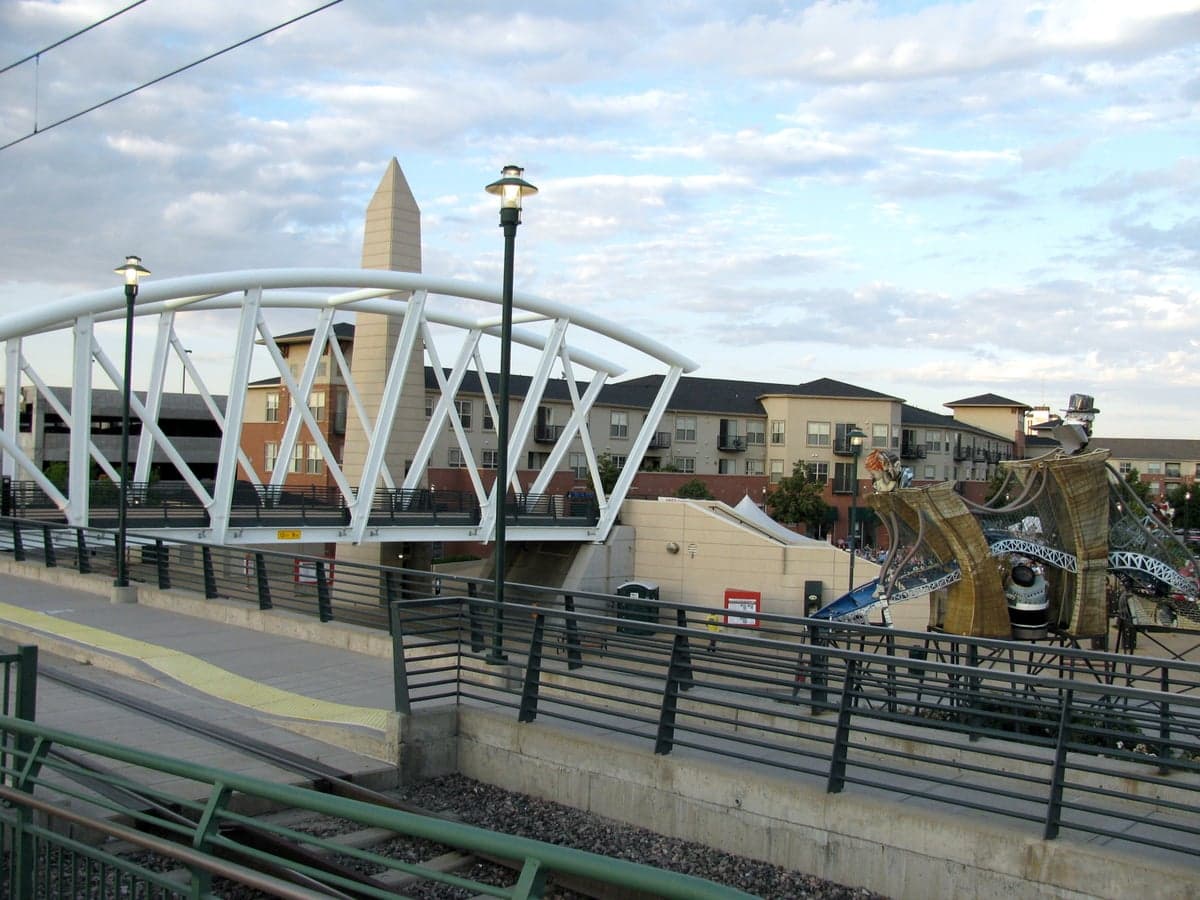
Photo: Wikipedia
Quality of Life in Englewood, CO
A high quality of life with strong walkability, manageable living costs, healthy neighborhood signals, and solid amenity access.
What does Quality of Life tell us?
Quality of Life blends cost of living, nearby amenities, socioeconomic signals, and neighborhood character. City-level scores represent the whole municipality; individual neighborhoods can differ.
What does this tell us?
Quality of Life blends cost of living, nearby amenities, socioeconomic signals, and neighborhood character. City-level scores represent the whole municipality; individual neighborhoods can differ.
Cost of Living
56% above national average
The Real Cost of Living in Englewood, CO for 2026
| Tier | Individual | Family (4) |
|---|---|---|
| Survival | $25k | $47k |
| Comfortable | $98k | $143k |
| Luxury | $143k+ | $222k+ |
| Elite (Top 5%) | $168k+ | $261k+ |
57%
The Area Signal
A metric tracking the socioeconomic signals of the area.


Hobbies
Explore the areaGroceries
10 within 10 miles
Gas
20 within 10 miles
Hospital
3 within 20 miles
Airport
DEN — Denver International
Post Office
USPS — Englewood, CO
Critical Amenities
Quality-of-Life Analysis
Englewood, Colorado, presents a quality of life defined by upper-middle-class affluence and a dense, walkable suburban character, drawing a mix of young professionals, established families, and empty-nesters who prioritize proximity to Denver without the city-center price tag. With a cost-of-living index of 156 (56% above the U.S. average), the city commands a premium for its location along the South Platte River corridor, yet remains notably more affordable than its immediate neighbors. The typical resident is college-educated, commutes roughly 23 minutes to work, and values the balance of urban access with a quieter, tree-lined residential feel.
Cost of living, housing costs, and affordability compared to Denver and Littleton
Englewood’s cost of living is steep relative to the national baseline, but it offers a measurable discount compared to Denver proper and the pricier enclaves of Cherry Hills Village and Greenwood Village. The median home value sits at $534,000, which is roughly $100,000 less than the Denver metro median and significantly below the $800,000+ figures seen in neighboring Littleton’s historic district. Median rent is $1,563, making it one of the more attainable rental markets in the south metro area for a two-bedroom apartment. The average commute of 23.1 minutes is shorter than the Denver metro average of 27 minutes, a direct benefit of Englewood’s position along the I-25 and Santa Fe Drive corridors. Property taxes remain moderate by Colorado standards, and the city’s lack of a local sales tax on groceries helps offset some daily expenses. For buyers, the trade-off is clear: you pay a premium over national averages, but you gain a 15-minute drive to downtown Denver and a school system that outperforms many neighboring districts on standardized tests.
Parks, schools, and what daily life is like for families and professionals
Daily life in Englewood revolves around a compact, pedestrian-friendly core anchored by the Englewood CityCenter redevelopment, which includes a light-rail station, a public library, and a civic green. The city operates over 20 parks, with the 80-acre Belleview Park offering a historic carousel, a petting zoo, and the South Platte River Trail for biking and jogging. Schools are a major draw: Englewood Schools (District 1) includes the highly rated Englewood High School (GreatSchools rating 7/10) and the STEM-focused Clayton Elementary. For families, the rhythm includes weekend farmers’ markets at the city center and easy access to the Denver Museum of Nature & Science or the Cherry Creek Reservoir, both within a 20-minute drive. Professionals appreciate the walkable lunch options along South Broadway and the direct light-rail connection to the Denver Tech Center and downtown. The city’s crime rate is slightly above the national average for property crime but well below Denver’s, and the Englewood Police Department maintains a visible community-policing presence. The overall feel is that of a self-contained suburb that doesn’t require a car for every errand, yet still offers quiet residential streets and mature trees.
Englewood is best suited for those who want a Denver-adjacent lifestyle with a lower commute time and a stronger sense of local community than the city’s core provides. Young professionals will find the rental market and transit access ideal, while families will value the school quality and park system. Empty-nesters downsizing from larger homes in Littleton or Highlands Ranch often gravitate to Englewood’s newer townhome developments near the light rail. The city’s high cost of living will deter budget-conscious movers, but for those who can afford the premium, Englewood delivers a reliable, amenity-rich quality of life that few other south-metro suburbs match at the same price point.
Crime in Englewood, CO
Higher crime rates than 69% of comparable U.S. locations.
Violent CrimeViolent Crime Analysis
Property CrimeProperty Crime Analysis
Crime Analysis
Englewood, Colorado, presents a challenging safety picture for prospective residents, with crime rates that significantly exceed both state and national averages. The city's violent crime rate stands at 653.5 incidents per 100,000 residents, while property crime reaches 4,257.3 per 100,000, placing it among the higher-risk suburbs in the Denver metro area. These figures are compounded by the broader political and judicial environment in the Denver region, where progressive district attorneys and judges often prioritize offender rehabilitation over public safety, a philosophy that critics argue contributes to higher recidivism and more criminals on the street.
Crime in context
Englewood's violent crime rate is roughly 75% higher than the national average and nearly double the Colorado state average. Property crime is similarly elevated, running about 40% above the national benchmark. For context, the city's violent crime rate is comparable to larger urban centers like Denver itself, yet Englewood lacks the population density that typically explains such figures. The Arapahoe County District Attorney's office, which prosecutes Englewood cases, has faced criticism for plea-bargaining down felony charges and declining to prosecute certain drug and property offenses, a pattern common in metro Denver's progressive judicial system. This approach, while intended to reduce incarceration, often results in offenders cycling quickly back onto Englewood streets.
What residents experience
For Englewood residents, the most tangible impact is property crime. Car break-ins, package thefts, and residential burglaries are frequent, particularly in neighborhoods near the Broadway and Santa Fe corridors. Violent crime, while less common in daily life, includes aggravated assaults and robberies that cluster around commercial areas and transit stops. Residents report that police response times have lengthened in recent years, partly due to staffing shortages and partly because of a district attorney's office that is reluctant to pursue charges for many property crimes. The result is a perception that reporting crime yields little justice for victims, which further emboldens offenders.
Neighborhood-level variation
Safety varies considerably within Englewood. The western neighborhoods near the Littleton border, including the historic Englewood East area, generally see lower crime rates, with some blocks experiencing 30-40% fewer incidents than the city average. Conversely, the area around the Englewood CityCenter and the light rail stations on the city's eastern side has higher concentrations of both property and violent crime. The Englewood Housing Authority's scattered-site units have also been associated with elevated crime reports in adjacent blocks. Prospective residents should examine block-level crime maps and consider that the city's overall high rates mask pockets where daily life is relatively safe, though the progressive judicial climate means that even these areas are not insulated from regional crime trends.
* Values derived from national, state, county, city and local statistics and may differ in a specific area. Last updated: 2026-04-20T06:55:12.000Z
Narrative content on this page is AI-generated and may contain mistakes. Verify any details that matter before acting on them.
ReloMaps may earn a commission from affiliate links at no extra cost to you.